QUESTION:
HOW CAN I NOW INVEST IN TREASURIES WITH AN IRON-CLAD RETURN OF MY MONEY, A RETURN ON MY MONEY, AND POSITION MY MONEY FOR INCREASING LONGER TERM RETURNS SOON?
SUMMARY:
TWO ECONOMIC FACTORS ARE NOW WORKING FOR YOU: THANKS TO THE “INVERSE YIELD CURVE” SHORTER TERM TREASURES ARE PAYING MORE THAN LONGER TERM TREASURIES AND THE FEDERAL RESERVE BANK IS HIKING RATES TO COMBAT INFLATION.
The marketplace has doubted Federal Reserve Chairman Jerome Powell’s increasing rates rhetoric.
Traders had assumed a 3.5% federal funds top before Powell would blink. That will be achieved in November 2022 and he seems intent on going further to fight inflation, to almost 4.0% by July 2023 in fractional monthly increments.
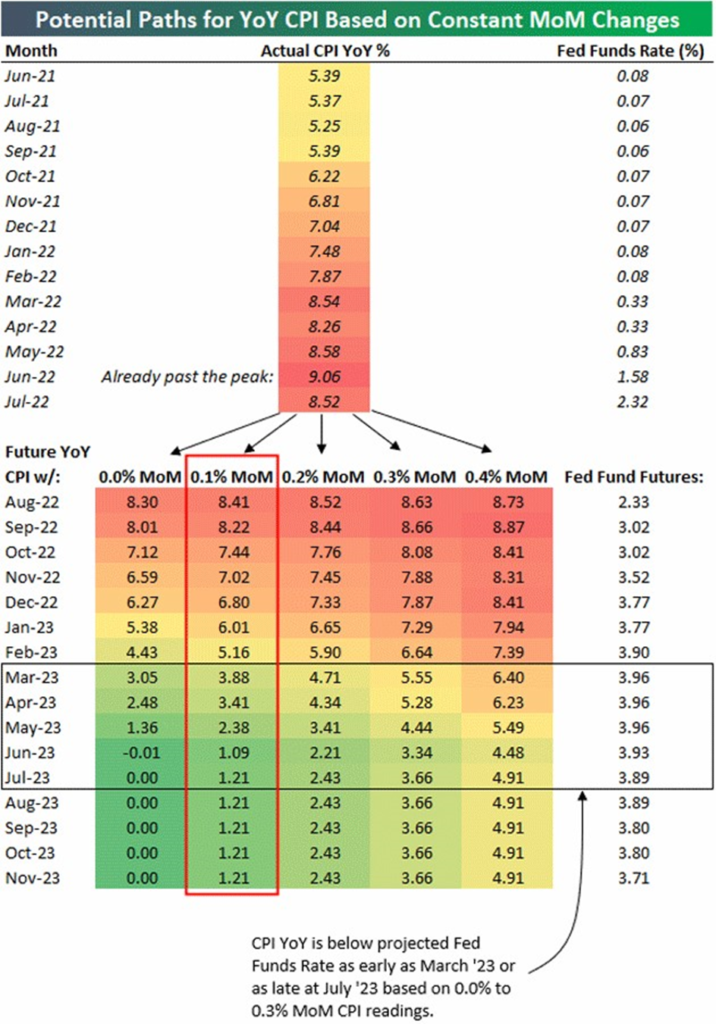
Below is an interesting chart from Bespoke Investment Group in London. They look at the preceding 12 months of actual Consumer Price Index (CPI) data and then show what inflation would be at various monthly average levels of inflation. Study this chart, and then I’ll try to explain.
Source: Bespoke Investment Group
Last month, inflation increased (MoM) 0.1%. Bespoke shows that if inflation keeps increasing 0.1% a month, it will be March 2023 before yearly inflation drops below 4%—and May before it has a 2% handle. At that point, Powell would be expected to pause.
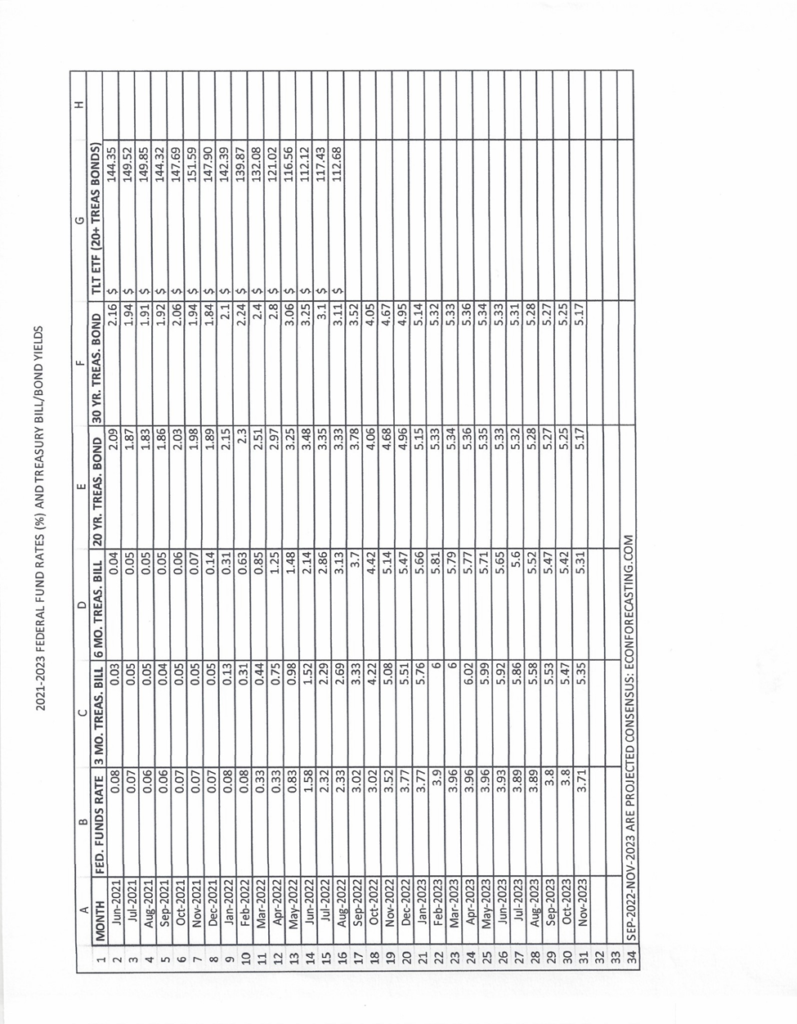
Are you interested in projecting where Treasury yields, both short and long term, may be along the spectrum as Powell continues to raise the federal funds rate? Based on Bespoke Investment Group’s excellent analysis I have recorded just that on the attached Excel spreadsheet itemizing monthly rates for the three and six month Treasury bills and the twenty and thirty year Treasury bonds consisting of historical yields from June-21 through August-22 and projected yields from September-22 through November-23. As the federal funds rate increases to bring inflation down to 1.21% by July-23, as measured by the CPI, you can see Treasury yields – historical and projected, increase. Bills go from 0.030.04% yields in June-21 to almost 6.00% in July-23. Bonds go from 2.09-2.16% yields in June-21 to 5.27% each in July-23. Please know that “projected” consensus comes from an excellent website – www.econforecating.com which you should visit.
Normally longer-term bonds pay higher yields to compensate for lengthier interest rate risk than shorter term bills. Not so at the present time because of the inverted interest yield curve you’ve heard about. That situation will reverse and bonds again will pay more than bills. For that to happen though, it will require downward-spiraling inflation and probably a recession – back-to-back negative quarters of growth as measured by the gross domestic product (GDP), which has occurred as economic conditions worsen. At bottom, it’s all about returning to an economy which regains a healthy balance: not one with growth at full steam, but one that is growing healthier with a necessary balance of moderate growth and low inflation. This is precisely the economic setup the Fed seems aiming for with normalization of monetary policy through policy tightening.
I have also built a column titled “TLT, +20 yrs” an iShares ETF capturing the long end of the yield curve in a very liquid fund with durations of 20-years or longer. You’ll see on my spreadsheet that TLT prices have declined from $144.35 on June-21 to $112.68 in August-22 as the federal funds rate has increased from 0.08% to 2.33%. That correlation will continue as Powell pushes rates up to a projected federal funds rate of almost 4%. However, an economic pullback through a recession, continuing stock market losses, defaults, currency illiquidity, etc., will drastically bring down real interest rates if Powell does not curtail rate increases before that. At that point, long term bonds will normalize, again paying investors a premium – which could be substantial for holding long-term bonds as prices of newly-issued bonds decline below prior-issued prices. At that point newly-issued bonds yields and TLT will reward those investors. That time is not yet here – another reason to stay short term now.
When it does happen, expect a TLT redo similar to 2018-2019: In 2018 TLT was deeply negative, down 10.5% from January through October but subsequently had a 25% rebound in six months which coincided with a fall in equity prices and Powell increasing the federal funds rate to keep inflation in check.
As I study my Excel spreadsheet, I’m inclined to buy at www.treasurydirect.gov the 3-month Treasury bill. For October through December 2022 it is projected to pay a yield 0.32% less than the 6-month bill, but gives me the option to roll the bill over at the end of December for another 3-month bill which is projected to yield 0.22% more than the 6-month bill yield. Rolling it over a third time at the end of
March-2023 renders additional yield of 0.29%. More important, however, it preserves my control over the “time value of money” for another day. When the yield curve normalizes and real interest rates come down, I’ll then be looking to invest longer term, probably in TLT.
For your financial health and well-being, Dan Steele*
*The information provided herein is ONLY for discussion purposes. I provide no warranty as to the accuracy and timeliness of the information/data provided and I make these tools freely available exclusively for purposes of initiating discussion. I reserve the right to modify and/or update my rationale and tools without any notice. I am not licensed by FINRA or any other licensing authority to sell financial products or to give professional financial advice. Your reliance on any information provided herein shall not be interpreted or regarded as personalized investment advice. My information/data is only a part of many factors to consider when investing money. When you do so you are on your own.


