SUBJECT:
Trading Math (lives in trading log folder) to trade like a pro!
QUESTIONS:
With every trade, do you first determine the amount of your trading account you can put at risk? Do you then calculate your expected return to the dollar? I.e., do you determine a risk/reward ratio for each trade? Over your trading history, do you know your win/loss ratio, long range and for intermediate periods of time?
SUMMARY:
The latter inquiry, i.e., knowing what type of trader you are and how well you are doing, will inform you about the amount to trade now and how much you may risk based on your probability analysis. By way of summary, watch this brief video:
Next, bring up this YouTube presentation, a brilliant tutorial presented by The Organic Chemistry Tutor
Using this single resource, my paper, in the following 3 STEPS, you can master the science (and necessarily the math) of successfully managing a portfolio of stocks – knowing when and how much to buy and sell.
DISCUSSION:
Properly package a stock/equity purchase with just two questions:
What amount am I putting at risk?
What amount do I expect to earn?
I.e., it’s all about sizing my purchase by measuring distance from an entry point that, I determine, to a stop loss point that, I determine, to figure an informed reward to risk ratio of a trade in three steps?
Abou RISK: The simple math is: Reward to Risk Ratio
v v
$60 ¸ $20 = 3 to 1
USE MY CURRENT STATS: A RISK/REWARD RATIO OF (SAY) 2.333 AND A WIN/LOSS RATIO OF (SAY) 40%. THIS IS WHAT THAT MEANS:
RISK/RETURN: divide all my prior percentage gains by percentage losses indicating how much I will earn based on how much I am willing to lose for a given amount of capital.
Percentage gain
Percentage losses
WIN/LOSS: indicating how many times I will profit/how many times I will lose.
# winning trades
Total # of trades
Combining them will tell me what type of trader I am, how well (or bad) I am doing, and how I should manage my next trade as to probable/expected reward to risk (ratio). I.e, “Expectancy” means what I expect to gain or lose in a system that has a 40% win rate or what I expect to gain or lose, on average, if I risk, e.g., $10,000 per trade? Taken together, the Risk-Reward and Win-Loss ratios are two essential parameters for trading.
- Win/loss and win rate metrics tell me how often I am winning vs. losing money on trades.
- My risk/reward ratio expresses how much I’m willing to risk losing vs. how much I could win on trades.
- My risk/reward MUST make sense with my trading plan
- In general, I should aim for a win rate of 50% to 70% but a win rate of 35-40% works, a win/loss ratio above 1.0, and a risk/reward ratio below 1.0.
- The objective is to successfully craft trades and to leave you profitable overall.
These tasks can be accomplished in the three steps that follow.
STEP I
WHAT IS MY RISK/REWARD RATIO?
WHAT IS MY WIN/LOSS RATIO?
Risk Reward Math in dollars:
Risk Reward (a risk/reward ratio of 1 : 2)
$1.00 $ 2.00
100.00 200.00
1,000.00 2,000.00
What is my Risk? Potential Reward
Buy at $4,000 (100 shares) 4,000
Stop loss @ 3,600 6,000
At risk 400 to make 2,000 expected reward
Risk : Reward 1 : 5 2,000 / 400 10,000 – 6,000 / 10,000 = 0.40%
Or per share (buying 100) $40 a share:
Math is: 400 2000 1 : 5 for every $ @ risk I can earn $4 20/4= 5
400 400
4 20 1 : 5
1 4
Note that Risk Reward and Win Loss ratios are figured in fractions:
The Risk-Reward ratio is the capital I stand to lose (risk) to obtain a specific profit (reward).
If my Risk-Reward is 1:3 it means that I am willing to lose 1 in order to gain 3.
For instance, if I risk $1,000 then my expected return is $3,000.
The Win-Loss ratio, also known as success ratio, is instead the number of my winning trades in respect to the number of my losing trades.
In mathematical terms, the formula is:
Win-Loss = Winning Trades / Losing Trades
Assuming I made 30 trades of which 18 are wins and 12 are losses, then my Win-Loss ratio is 18/12 or 1.5. This means that I am winning 50% more trades than I am losing.
I can also easily derive my Win-Rate and Lose-Rate:
Win-Rate = 18/30 = 0.6 = 60% (I win 6 trades out of 10)
Lose-Rate = 12/30 = 0.4 = 40% (I lose 4 trades out of 10)
The win/loss Simplified Sharpe Ratio (average dollar earned divided by the average dollar lost) is
another calculation method: (2,000/5) = 400 (1,000/2) = 500 So, 400/500 =0.8
A risk/reward ratio that is less than 1 indicates an investment with greater potential reward than risk. Ratios greater than 1 indicate investments with more risk than potential reward. A ratio equal to 1 indicates equal risks and rewards.
In general, it’s better to make trades with low risk/reward ratios, like 0.4 or 0.6, because that implies the investments will produce more profits than losses (less risk).
STEP II
ACHIEVING BALANCE
RISK/REWARD AND WIN RATE ARE MY INGREDIENTS, WHEN APPROPRIATELY BALANCED, WILL ACHIEVE GREATER PROBABILITIES OF HIGHER RETURNS WITH LESS RISK
I achieve appropriate balancing by determining what minimum win rate I need for a trading system to break even given a risk/reward ratio of x : x. The more risk (e.g., where I set my stop loss) I assume, the more my win rate must be. That is the balance.
To break even, “expectancy” must be greater than -0-. RISK = “probability” of winning (to follow).
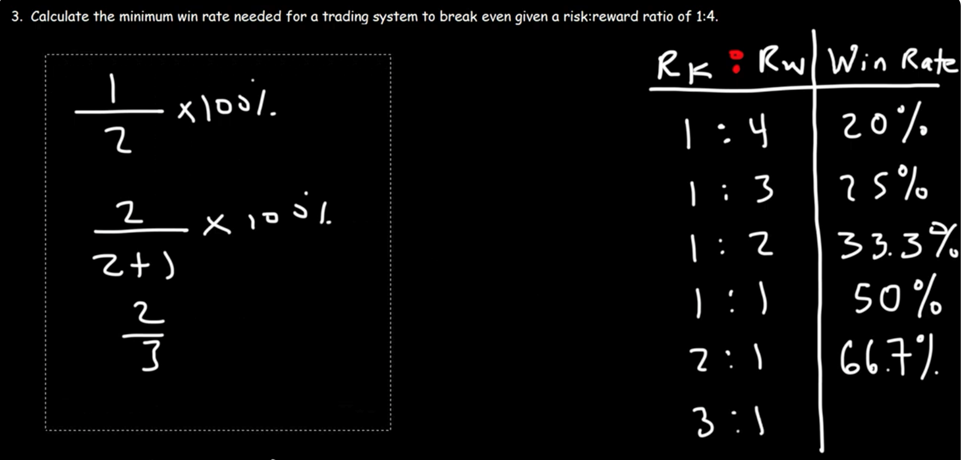
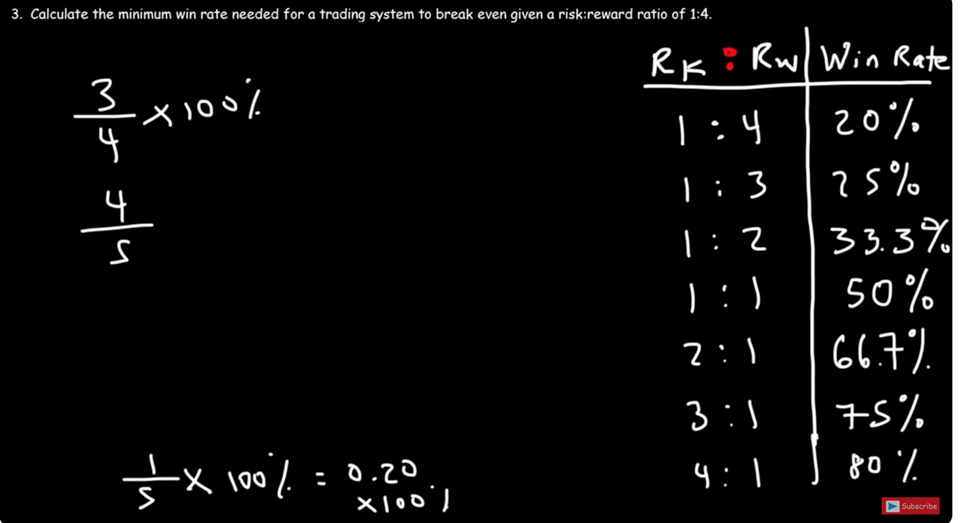
RISK:REWARD WIN RATE
Given a risk / reward ratio of 1 : 4 1 : 4* must be greater than 20%
(like buying options) ¯
this is a good trading system ® 1 : 3 25
1 : 2 33.3
1 : 1 50*
2 : 1 66.7
3 : 1 75
(like selling options) 4 : 1** 80
*A trading system that offers a high reward relative to the amount placed at risk requires a relatively low win rate in order for me to break even. Probability of winning is low.
**A trading system that offers a small reward for a large amount placed at risk requires a relatively high win rate to break even.
These are the Organic Chemistry Tutor’s slides from which I derived the above chart:
ARMED WITH THAT INFORMATION, HERE ARE NECESSARY EQUATIONS TO SOLVE THESE RISK-REWARD AND WIN/LOSS QUESTIONS TO CREATE A TRADE:
(1) minimum win rate needed to break even if my risk : reward is ___:___?
(2) calculate the amount I expect to earn, on average, if I risk $1,000?
(3) what is the expectancy of my trading system that has a win rate of 40% and a risk reward ratio of 1 : 2? I don’t know the amount I am risking.
(4) how much should I expect to gain or lose in –3- above, if I risk $10,000 per trade?
(5) calculate the minimum win rate needed for a trading system to break even given a risk reward ratio of 1 to 4 ?
IT’S ABOUT FIGURING MY EXPECTANCY AND PROBABILITY OF A POSITION
ABRIEVATIONS:
E is expectancy X1 is amount I can win P1 is probability of amount I can win
X2 is amount I can lose P2 is probability of amount I can lose.
(Pw) is probability of winning PL is probability of losing. Rew is reward
E = X1 P1 + X2 P2 E = reward (Pw) + risk (PL) Rk is risk
-1-
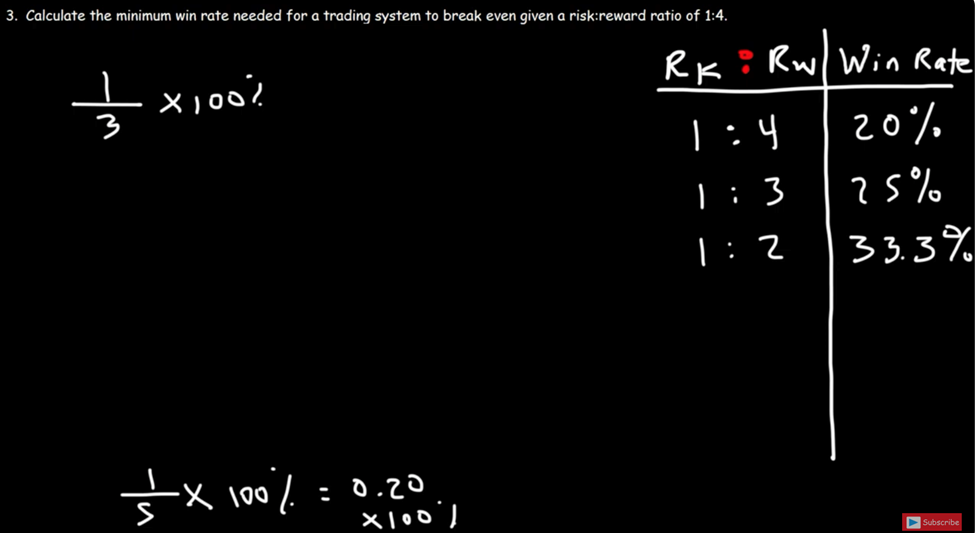
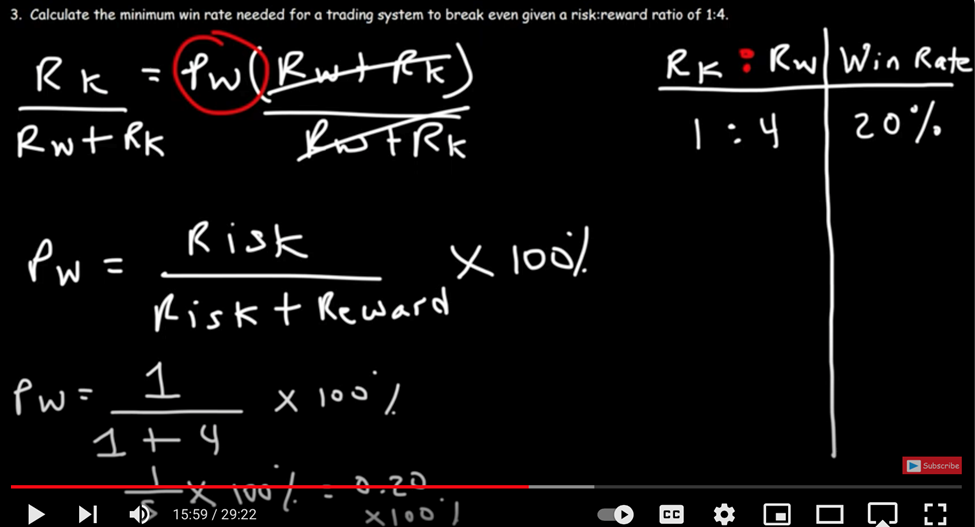
*WHAT MINIMUM WIN RATE DO I NEED TO BREAK EVEN WITH A RISK-REWARD RATIO OF 1 : 4, etc.:
Pw = 1
—— x 100%
1 + 4
Pw = 1
—— x 100% = 0.20
5 x 100% = 20%
*Formulas re: the Risk/Reward and Win Rate chart, above, are in the Organic Chemistry Tutor’s slides at page 9, infra.
-2-
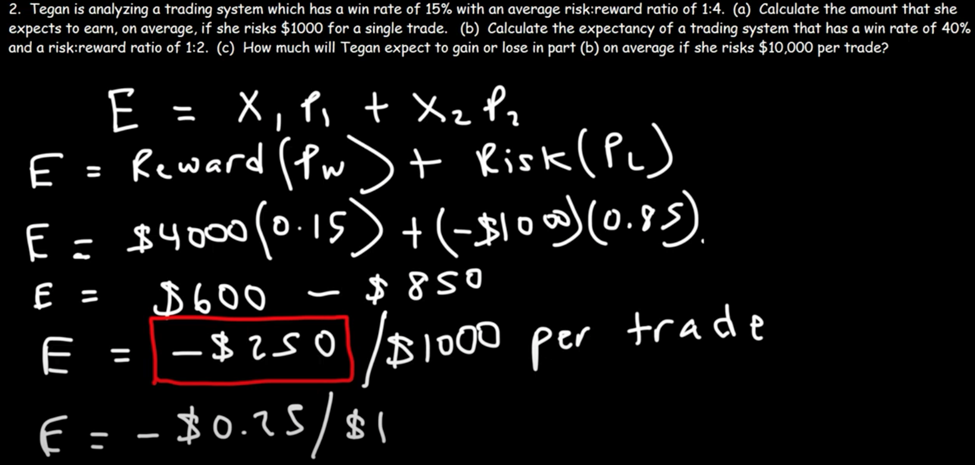
CALCULATE THE AMOUNT I EXPECT TO EARN, ON AVERAGE, IF I RISK $1,000 FOR ONE TRADE:
My win rate is 15%; My average risk reward ratio is 1 : 4. Calculate the amount I expect to earn, on average, if I risk $1,000 on a single trade?
Problem: What is the expectancy of my trading system that has a potential reward ratio of 1 : 4, here 1,000 to 4,000. This is the math:
My E ratio is 1 or 1,000 (risk) : 4 (reward) or $4,000. So, I am risking 1,000 to gain 4,000.
With my 15% win rate, then 15 ¸ 100 = 0.15 what I can lose. The remainder is 85%
| Start here: RK : RWD (risk: $1,000) 1 4 (reward: $4,000) | E = $4,000 (0.15) + (-1,000) (0.85) (max. probability is 100%). 15/100 x 0.15 1 – .15 = 0.85 |
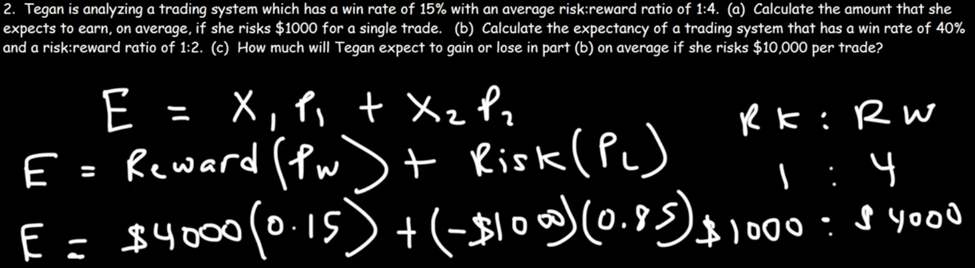
So now: 4,000 x .15 = 600 4,000 x .85 = 3,400. E then is $250
This means: I expect to lose $250 for every $1,000 I risk per trade on average.
250 / 1,000 per trade = negative 0.25
This is a negative #
I expect to lose $250 for every $1,000 I risk on average. So, divide 250 / -1000: my expectancy is -.25 cents for each dollar. On a $10,000 trade, I’d expect to lose $2,500 on average for ea. trade. So, I’d be losing 25 cents for each $1.00.
Risking 10,000, I’d expect to lose $2,500 on each trade, on average.
THIS MEANS THAT: My expectancy is negative. I’ll lose 25 cents for every dollar at risk over time. E = 2 (0.40) + (-1) (0.60). This is an unprofitable trading system, losing 25 cents per share. I.e., negative .25 for every dollar at risk.
START YOUTUBE TAPE AT 8:30:
-3-
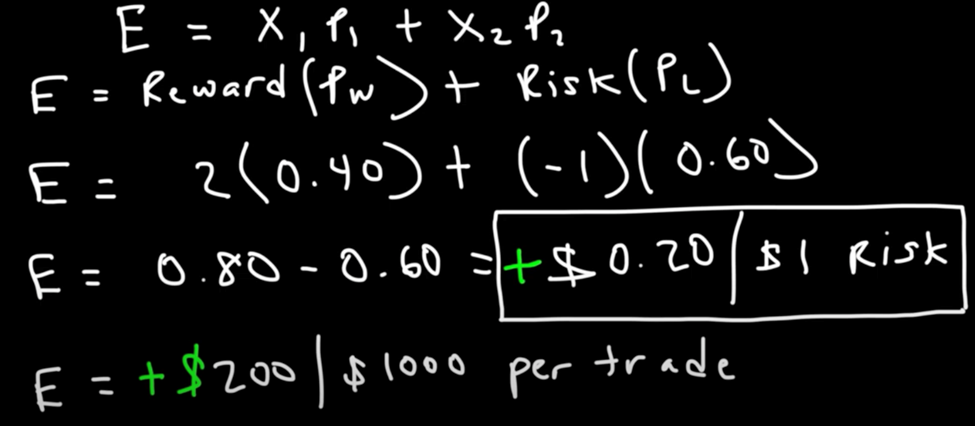
WHAT IS THE EXPECTANCY OF MY TRADING SYSTEM THAT HAS A WIN RATE OF 40% AND A RISK REWARD RATIO OF 1 : 2? I DON’T KNOW THE AMOUNT I AM RISKING.
E = X1 P1 + X2 P2 E = reward (Pw) + (PL)
My reward is 2; Probability of winning is (0.40); amount I am risking is one (-1); Probability of losing is 60% (0.60) i.e., 100% of 40% is 60%.
E = 2 (.40) + (-1) (0.60) (100 minus win rate of 40 = 60 my probability of losing)
to make ¬ risking (risking a dollar to make 2 dollars)
E = 0.80 – 0.60 = PLUS $0.20 / $1 (risk).
This is a positive #
So, 100% – 40% = 60% Risking $1.00 to make $2.00
2 X .40 is 80 – 60 = 20 cents for every $1.00 risked per trade. THIS IS A GOOD SYSTEM – making money per trade
THUS, THE ANSWER: The expectancy of my trade is 20 cents for every dollar at risk.
So, if I risk $1,000 per trade, I would expect to earn $200 ($200 / $1,000 below). This is my risk reward. This is my probability of winning! I.e., I expect to make $200 for every $1,000 trade. Long run, I’ll make money with this trading system because I know my risk-reward ratio and my probability of winning.
-4-
HOW MUCH SHOULD I EXPECT TO GAIN OR LOSE IN -3- ABOVE, IF I RISK $10,000 PER TRADE?
Ok, so my win rate is 40% and my risk/reward ratio is 1 : 2.
E = 2 (0.40) + (-1) (0.60)
^ ^ ^
reward ratio / my win rate / r i s k (if I win 40% then I lose 60%)
Multiply .20 (difference) by $1,000. So here, multiply .20 by $10,000 ($2,000 for $10,000):
E = 0.80 – 0.60 = $0.20 / $1
positive # risk ANSWER: I’ll earn $2,000 for every $10,000 at risk, or .20 per $1 at risk.
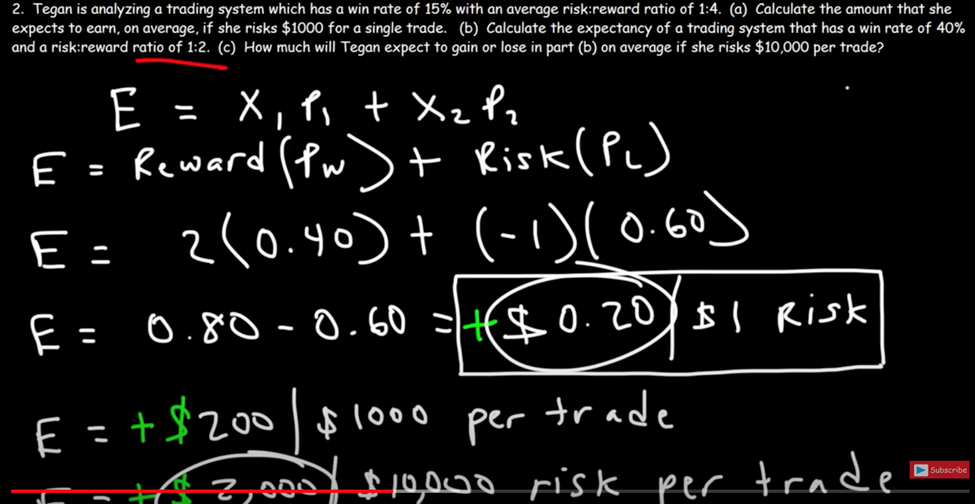
SO, NOW YOU KNOW HOW TO CALCULATE THE EXPECTANCY OF A TRADING SYSTEM AND THE AMOUNT YOU EXPECT TO WIN PER TRADE GIVEN THE AMOUNT YOU ARE RISKING PER TRADE.
-5-
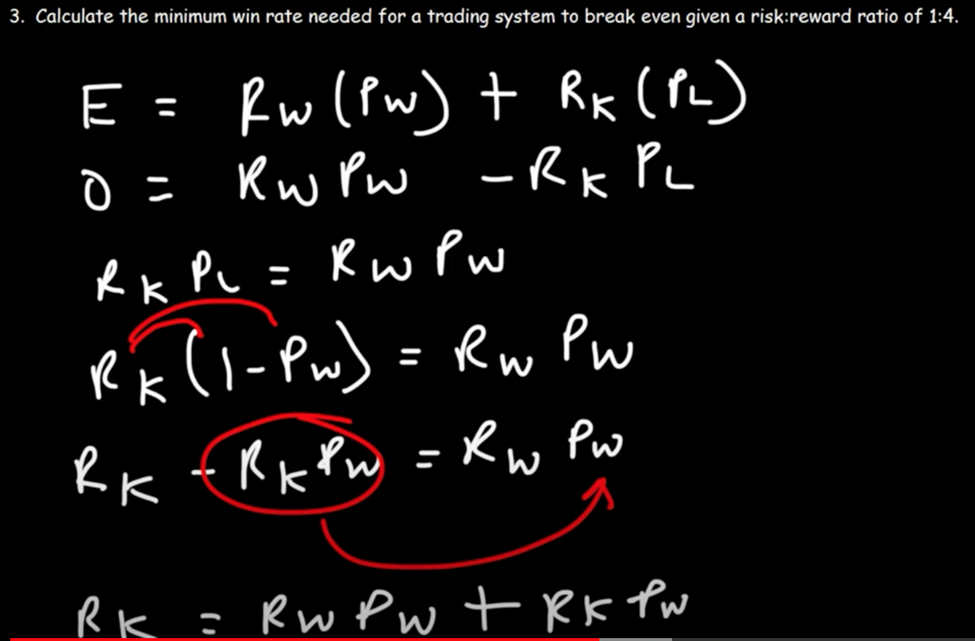
CALCULATE THE MINIMUM WIN RATE I NEED FOR A TRADING SYSTEM TO BREAK EVEN GIVEN A RISK REWARD RATIO OF 1 TO 4 ?
START YOUTUBE TAPE AT 11:50
Here are formulas and slides for data charted on Page 3, above, where calculations have been summarized on the chart. So, no need to do the math on this question.
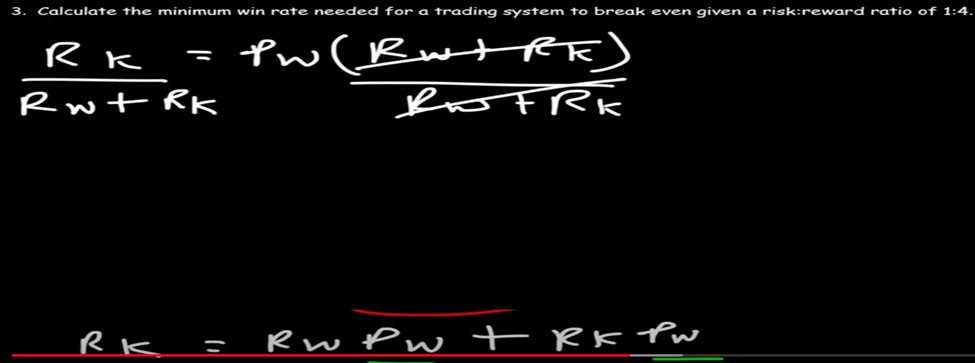
E = Rw (Pw) + Rk (PL)
0 = Rw Pw – Rk (PL) 0 = expectancy to breakeven
negative value
Rk (PL) = Rw (Pw)
Rk (I – Pw) = Rw x Pw
Rk (1-) Pw = Rw Pw if 40% chance of winning, there is 60% chance of losing
minus
Rk – Rk x Pw = Rw Pw
Rk = Pw Pw + Rk Pw
Rk = Pw (Rw + Rk)
Rw + Rk
Pw = Rk________ X 100%
Rk + Rw
STEP III
WHAT IS MY BATTING AVERAGE (BA)
Divide my number of winning trades by my total number of trades:
____ WINNING TRADES______
TOTAL NUMBER OF TRADES
Example: 5 / 7 = 0.7143 x 100 = 71.43% = 714 That is my BA.
Now, go to the Google spreadsheet, attached below, to perform this calculation. Simply input my total number of trades and my win-loss ratio I calculated in Step I, page 1. This will direct the spread sheet to the relevant data sheet where I will locate my average gain and average loss “pair” stats located in the first two columns of the spreadsheet. Now, in the top row I locate my batting average (BA). Find there the coordinates’ percentage of my average gain/average loss (left two columns) and batting average (top row). E.g., My average gain is 8%; my average loss is 4%; and my BA is 40%. Thus, I know my trading system return 17.03%
LET’S TRADE
WORKING THROUGH STEPS I, II, AND III, I CAN NOW CREATE WINNING TRADING STRATEGIES BASED ON MY:
-initial reward to risk ratio
-final win/loss ratio
-final BA
But first realize and understand that these three factors work together by adjusting back and forth. E.g., If I have a high percentage win rate and a medaka BA I’ll approach my next trade in one way, whereas, if I have a low win rate and a great BA I’ll approach my next trade in another way. And it matters because it determines, for example, in my next trade whether I’ll work with a 1:2 or a 1:3 risk/reward ratio. I.e., For the amount of capital I have in my trading account, on this trade, do I take on more risk or less risk? Taking on less risk means scaling down on the percentage of where I place my stop loss order. But is the average volatility of the stock I am buying high, low, or moderate? And if it’s a high volatility stock will a tight stop loss order likely take me out of the trade? Trade assuming that every position will get stopped out when you take it.
Putting it together, our findings/results all come down to fractions/decimals’/ratios. Let’s review the math of trading one more time:
The Risk-Reward ratio is the capital I stand to lose (risk) to obtain a specific profit (reward).
If my Risk-Reward is 1:3 it means that I am willing to lose 1 in order to gain 3.
For instance, if I risk $1,000 then my expected return is $3,000.
The Win-Loss ratio, also known as success ratio, is instead the number of my winning trades in respect to the number of my losing trades.
In mathematical terms, the formula is:
Win-Loss = Winning Trades / Losing Trades
Assuming I made 30 trades of which 18 are wins and 12 are losses, then my Win-Loss ratio is 18/12 or 1.5. This means that I am winning 50% more trades than I am losing.
I can also easily derive my Win-Rate and Lose-Rate:
Win-Rate = 18/30 = 0.6 = 60% (I win 6 trades out of 10)
Lose-Rate = 12/30 = 0.4 = 40% (I lose 4 trades out of 10)
The win/loss Simplified Sharpe Ratio (average dollar earned divided by the average dollar lost) is
another similar calculation method: (2,000/5) = 400 (1,000/2) = 500 So, 400/500 =0.8
A risk/reward ratio that is less than 1 indicates an investment with greater potential reward than risk. Ratios greater than 1 indicate investments with more risk than potential reward. A ratio equal to 1 indicates equal risks and rewards.
In general, it’s better to make trades with low risk/reward ratios, like 0.4 or 0.6, because that implies the investments will produce more profits than losses (less risk).
Knowing how this math works, let’s now review possible back and forth outcomes in an Information Ratios Chart. The Chart, discussion, and examples are credited to a valuable article authored by Morgan Stanley Investment Management Counter Point Global Insights titled Dispersion and Alpha Conversion, “Consilient Observer” April 14, 2020 by Michael J. Mauboussin and Dan Callahan, CFA:
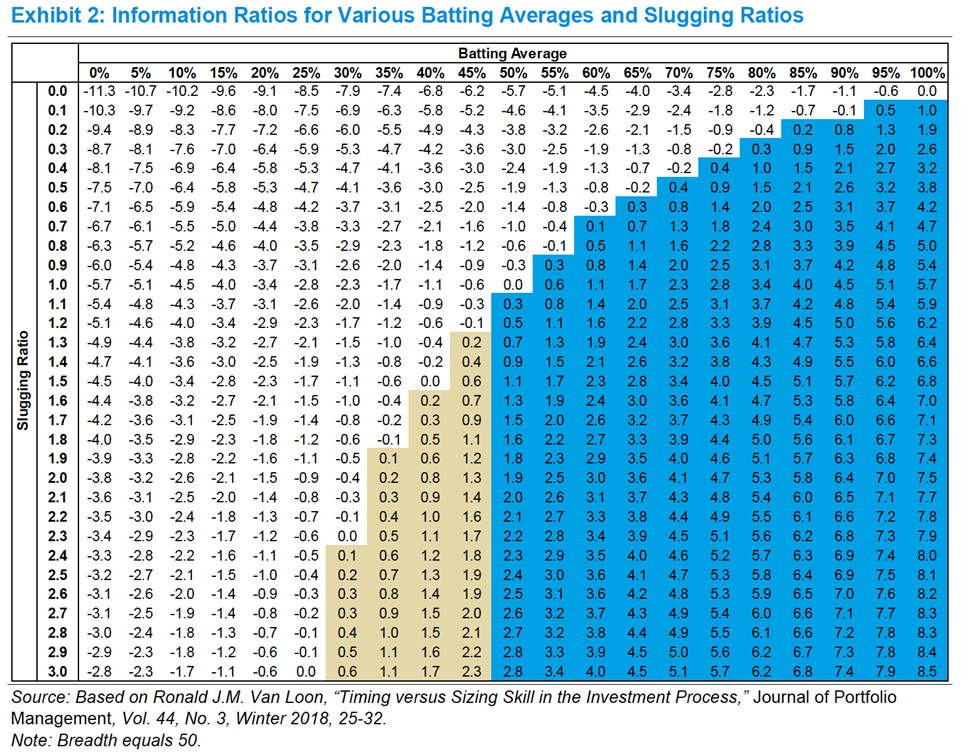
What do Batting Average and Slugging Ratios mean in the Information Ratios Chart, above?
The Batting Average “BA” is about my security selections. My ability to find securities that realize returns in excess of a benchmark after adjusting for risk.
The Slugging Ratio, A/K/A Win/Loss Ratio, is about how often I (an investor) am correct because of my ability to “position size.” Position sizing measures my ability to make each investment the appropriate size to earn the highest return possible for an assumed measure of risk.
Highlighted areas (grey and blue), above, are coordinate ratios where my BA percent and my Slugging Ratio percent permit me to be right less than half the time I trade and, nevertheless, deliver a positive return or “information ratio” (IR). IR measures the return of a portfolio adjusted for risk by dividing the portfolio’s excess return versus a benchmark by a tracking error. The numerator reflects how well the fund does versus its benchmark and the denominator reveals how much risk the investor took to attain those results. The IR is negative if a fund realizes returns less than its benchmark.
For us mere mortal investors, our take-away is simply back to our fractions:
A risk/reward ratio that is less than 1 indicates an investment with greater potential reward than risk. Ratios greater than 1 indicate investments with more risk than potential reward. A ratio equal to 1 indicates equal risks and rewards.
In general, it’s better to make trades with low risk/reward ratios, like 0.4 or 0.6, because that implies the investments will produce more profits than losses (less risk).
That means, assuming I made 30 trades of which 18 are wins and 12 are losses, then my Win-Loss ratio is 18/12 or 1.5 which means that I am winning 50% more trades than I am losing.
REMEMBER ALWAYS:
A win/loss ratio of 1.0 and batting average of 50% is breakeven;
A win/loss ratio of 2.0 and batting average of 33% is breakeven;
A win/loss ratio of .33 and batting average of 75% is breakeven.
Summarizing, sound investing is the skill/ability to buy or sell securities that (1) generate excess returns and (2) allocate the proper amount of capital to those opportunities.
Although my BA tells me how often I am right if BA is correlated along with my wins/losses score, this “Information Ratio” tells me what really matters – how much money I make when I’m right versus how much money I lose when I’m wrong. How often I am right or wrong, by itself, is not dispositive.
With this information, what do I know?
Assume Trader A has a 0.3 Slugging Ratio with an 80% BA; Trader B has a 2.6 Slugging Ratio with a 30% BA. Both have an IR of 0.3.
Both Traders, in than own ways, are wrong more often their right, but when right, each makes a lot of money.
Trader A does it with an incredible BA (way more wins than losses) (35-40% are good BAs);
Trader B does it with an excellent Slugging Ratio–Win/Loss Ratio (notwithstanding a BA below 50%).
With this information, find where each Trader lands in the IR Chart, above. Which color shade do you attribute to Trader A and Trader B?
Guess what: in real life Trader A is Warren Buffett with a high Batting Average and Trader B is George Soros with a “terrible BA—it’s below 50% and possibly even as low as 30%, but when he wins it’s a grand slam. ‘If you’re right in a position you can never be big enough.’”*
*Quoting Scott Bessent, former chief investment officer (CIO) of Soros Fund Management, now the chief executive officer and CIO of Key Square Group, an investment partnership he founded [internal quote attributable to George Soros].
AT THE END OF THE DAY, it’s all about preserving/protecting capital in your trading account so you can trade another day and how you can best set trades to achieve that result. As stated at page 11, your Google Spreadsheet will tell you what type of trader you are based on its “pairing” statistics – your trading statistics. Using that information, you must know before you go into a trade how much you are willing to lose. Your “pairing” statistics provide you with the information you must have to “position size” every trade. It is one of the most important things successful professional traders focus on – the one percent of traders. In every trade, put that number in writing – how much you are willing to lose/risk on that trade! And beyond that, if you hold more than one position write down how much you are will to lose/risk if all positions get stopped out. That means that every position you have gets a hard stop through stop limit orders executed at the time of each purchase.
AT BOTTOM, of the total amount of capital you have in your trading account do not put at risk more than one percent on any trade (ideally, .50 basis points)! Professionals may limit a trade to only 25 to 50 basis points based on their account size, trading frequency, and number of positions held.* A corollary rule is: of the total amount of capital you have in your trading account, do not trade/risk more than ten percent on all trades. I.e., all stop losses must not exceed more than ten percent of the amount held in your whole trading account.
* A basis point (often abbreviated as “bp”) is a unit of measurement equal to 1/100th of 1% or 0.01%. Convert percentages to basis points by moving the decimal point two places to the right and add “bp”. 1.25% becomes 125bp.; 1.255% becomes 125.5bp.
Risk Management position sizing examples on a $100,000 capital account are:
A 10% capital position, 5% stop = 0.05% equity at risk, a stop loss of $500;
(100,000 x 0.10 = $10,000 x 0.05 = $500.00)
A 5% capital position, 10% stop = 0.05% equity at risk, a stop loss of $500;
100,000 x 0.05 = $5,000 x 0.10 = $500.00);
A 10% capital position, 10% stop = 0.10% equity at risk, a stop loss of $1,000.
100,000 x 0.10 = $10,000 x 0.10 = $1,000).
NOTE THAT we are just discussing capital account RISK management rules, not other capital account asset drawdowns! What’s the difference you ask? Do you place a stop loss on every position you take? YES. Add them together. The total is your capital account amount at risk! The other capital account drawdowns are perhaps equity investments but because you placed stop losses on every position, amounts beyond those stop losses is not at risk. Once the stop loss is triggered, you are out of the position and not subject to additional losses.
The takeaway is: capital account drawdowns are, by themselves, not problematic but actual losses of capital are a problem.
NOW READY TO TRADE, HOW DO I ADJUST MY TRADING VIS-A-VIA MY BATTING AVERAGE AND SLUGGING/WIN-LOSS RATIOS FOR OPTIMUM SUCCESS?
Here are my growing observations of how I can adjust my trades depending on my latest trading stats by properly adjusting the risk/reward ratio with my win/loss ratio and BA:
A shorter term trader is likely to have a high batting average and a low win/loss ratio.
A longer term trader is likely to have a high win/loss ratio and a low batting average.
Winning trades, but book is not growing: very likely that win/loss ratio – potential loss versus potential profit) (% $ gains / % $ losses = ratio) (simplified Sharpe: average $ earned / average $ lost) is a very low #.
Note: low win/loss ratio does not take into account probability of an investment paying off – 1:1 may indicate low risk, but the risk is much higher when considering probability, e.g., low ROI, other fundamentals.
High win/loss ratio, poor BA: Large targets, but poor quality picks, so small % hit targets.
Improve BA (at expense of win/loss ratio): use wider stops and/or take profits earlier.
Improve win/loss ratio: use tighter stops and/or let winners run further. To prevent small profits being wiped out by losing trades.
As time frame gets bigger, win/loss ratio tends to go up and BA tends to go down. Some core traders are very successful with a 40% BA because they are obtaining a 3, 4, or 5 win/loss ratio. Good balance is a good win/loss ratio with a good batting average. Graph them in Excel to find upward consistency.
For your continued health, well-being, and trading success, Dan Steele
One Response
I really like your analysis and your ability to explain complex equations in plain, understandable language