SUBJECT:
THIS PAPER IS ABOUT THE ART OF TIMING YOU’RE INVESTING IN LONG TERM U.S. TREASURIES OF DURATIONS OF TEN YEARS AND LONGER AND SEEKS TO ANSWER THE FOLLOWING INQUIRES:
- WHAT EXACTLY ARE “LONG TERM” TREASURIES AND WHY IS THIS TOPIC PARTICULARLY RELEVANT NOW?
- ARE LONG TERM BONDS, E.G., THE 10-YEAR TREASURY, FAIRLY VALUED?
- HOW YOU CAN KNOW/MEASURE ON A CONTINUING BASIS THE RIGHT TIME TO INVEST IN U.S. TREASURIES OF DURATIONS OF TEN YEARS AND LONGER?
- IF NOW IS NOT THE “RIGHT TIME” TO PURCHASE LONG-TERM TREASURIES, WHAT THEN DOES THE “RIGHT TIME” LOOK LIKE?
- HOW CAN I KNOW WHEN THE NEXT BOND-BUYING OPPORTUNITY ARRIVES?
PART I
What exactly are “long term” U.S. Treasuries and why this topic is particularly relevant now?
Treasury “bonds” are part of a larger federal government family of Treasury securities, comprised of Treasury “bonds,” Treasury “notes” and Treasury “bills.” “Treasury notes and Treasury bonds are essentially the same type of instrument and only differ in original maturities,” explains Robert Johnson, professor of finance at the Heider College of Business at Creighton University. The government issues Treasury “bonds” in 20 to 30-year maturities and Treasury “notes” in maturities ranging as short as two years to as long as 10 years. Purchasers of Treasury bonds and notes receive an interest payment every six months. When you buy a Treasury, you are lending the U.S. government your money for a specified period (the “term”) and the government, as borrower, becomes obligated to pay you the designated yield (return) twice a year. With your loan, the Treasury Department funds government operations. You are the lender and the government is the borrower. For the purposes of this paper, “long term” is defined as any security with a term of ten years or longer.
Consideration of purchasing long term Treasury securities is particularly relevant: Following the Federal Reserve’s (“the Fed”) raising the federal funds rate to 5.5 percent to ward off inflation, as of September 18, 2024, it has begun to cut rates. Inflation, as high as 9.5 percent, has come down to under 4 percent.
The Fed’s target is to bring inflation down to two percent. Assuming the Fed is successful in reducing inflation and it does continue to reduce the federal funds rate, your purchase of long term bonds (recently paying yields of 4.57% for the 10-year, 4.86 for the 20-year, and 4.79 for the 30-year) will become a way more profitable in the secondary bonds market where people will pay you a big “premium” to own your long term bond as the longest-on-record inverse yield curve (short term duration bonds paying higher yields than long term duration bonds) corrects (more yield for longer duration bonds) and Treasuries new bond issue yields reduce, perhaps to what they were four short years ago (yields of just 0.23 percent between April 3, 2020 – Sept. 10, 2021). Yes, that’s correct, buying these bonds does not mean you have to hold them for 10, 20, or 30-year durations. And, because of the bonds “see-saw” behavior every time (yields up/bond prices down; yields down/ bond prices up), in a falling yield environment, everyone wants your higher yielding bond and will pay in the secondary market a big premium to buy your bond.
But the opposite is also true – why I am writing this paper: if yields rise beyond the point you pay for a bond a 10-year bond, say with a yield of 4.57 percent on January 19, 2025, the principle value of your bond will reduce, perhaps significantly, as (1) Fed fund rates rise again beyond the yield you are receiving and/or (2) capital markets push long term interest rates higher independent of what the fed does. Sticky or rising inflation may be the catalyst for one or both events.
The movement of long-term interest rates have declined in the last year by 0.9% for the 10-year; 0.13% for the 20-year; and 0.14% for the 30-year. But consider Gordon Long’s, analysis here, demonstrating that based on the long-term downward trend of long-term Treasuries since 1985, recent performance and recognition patterns going forward indicate renewed higher yields (black line off the chart) following the present small decline:
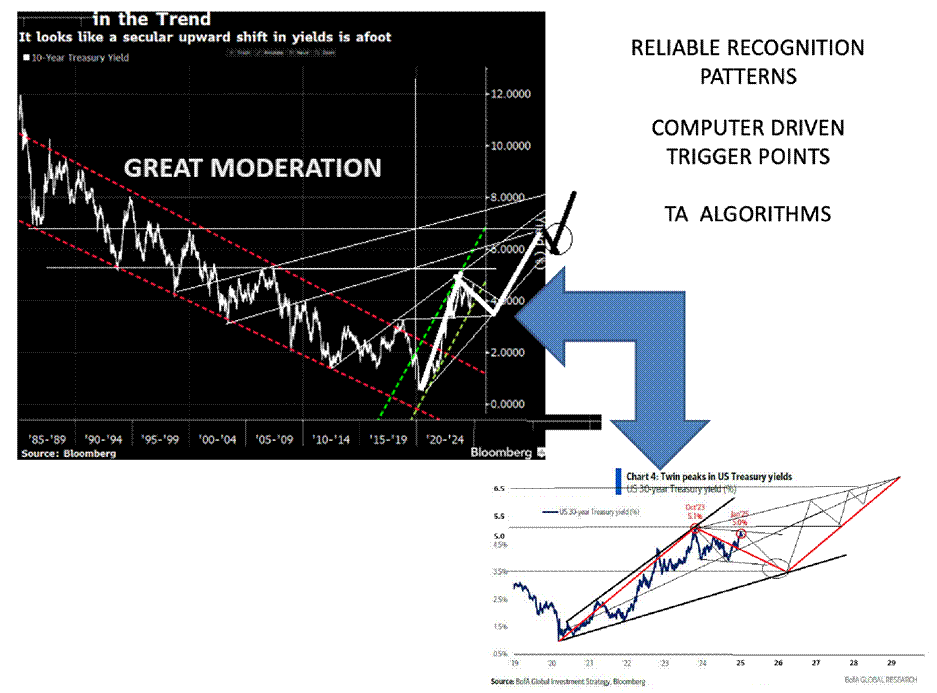
Matasii Micro Analytics and Technical Analysis
PART II
Are long term bonds, e.g., the 10-year Treasury, fairly valued?
Michael Howell of CrossBorder Capital determines that “now” is not the time to invest in long term Treasuries as he compares the “10-year actual” and to the “synthetic 10-year” in his chart, below at elapsed time 1hr, on youTube found here: https://youtu.be/ZVjf4N-ta20?si=tXaDICFBoQVcMp6v&t=60
The chart reflects a significant inflation-factor distortion between the Treasury 10-year yield (orange line) and return on Mortgage-backed securities indices (red line), “a difference of between 200 and 300 basis points (bpts)”. With the 10-year Treasury trading at a 4.546 yield on Jan. 27, 2025, this means that a 250 bpt increase, bringing the orange line up to the red line, would increase the true value of the Treasury10year yield to 7%. I.e., the 10-year Treasury is undervalued by 2.50%
Thus, should you invest in the 10-year Treasury with a yield now discounted by 2.50% when compared to mortgage-backed securities yields you run the very real risk that newly-issued 10-year yields will catch up to mortgage-backed securities from here and your previously bought bond’s underlying price will lose value in the secondary market due to the “see-saw” behavior of bonds. For our purposes, Howell does not define his “synthetic yield” indicator. Nor, is his chart “live” for our everyday reference.
PART III
How you can know/measure on a continuing basis the right time to invest in U.S. Treasuries of durations of ten years and longer?
From here you will have the capability to evaluate and measure the optimum time to purchase long-term bonds in real time every day.
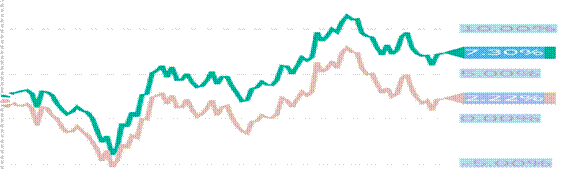
A. Compare the Mortgage-Backed Securities Index – symbol MBB with the I-Shares 7-10 Treasury bond ETF, symbol IEF
It’s now time to study our own chart, an x-ray of the 10-year duration U.S. Treasury bond (us10y) yield with the U.S. Mortgage-Backed Securities Index. To do so, we employ proxies which closely follow both of Howell’s indicators, the i-Shares 7-10 year Treasury bond ETF (IEF) and i-Shares MBS bond ETF (MBB) charted here:
¯
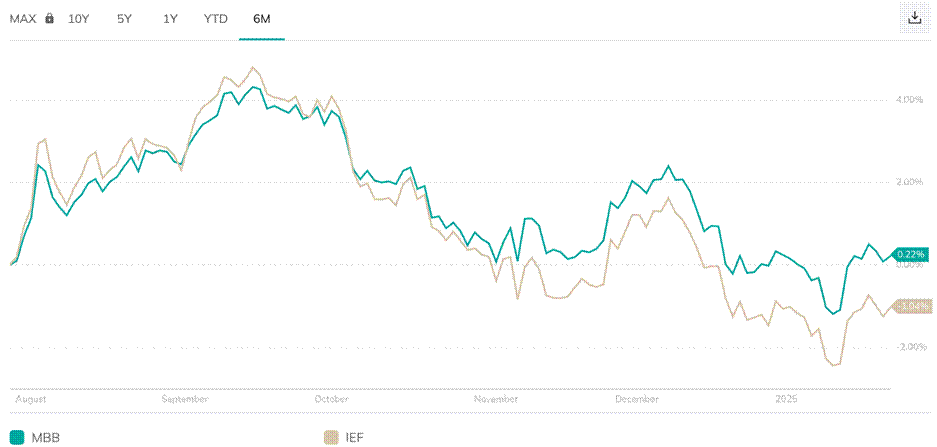
Notice right away, this chart shows the same yield discrepancy that is reflected in the prior Howell chart, except his “synthetic 10-year” is substituted for i-Shares’s 7-10 year Treasury bond ETF, symbol IEF. The correlation between MBB and IEF is 0.79, which is considered high. That indicates a strong positive relationship between their price movements. This “live” real time chart can be brought up at www.portfoliolabs.com. Seen here, and verifying Howell’s work, the chart shows a discrepancy between 7-10 year Treasury bond prices and mortgage-backed securities prices, apparent since May 27, 2023:
Despite the un-inversion of the yield curve, the larger chart shows that long bond yields have not moved higher. Not a good time to lock in long-term United States treasuries! When then, will be “the right time” to buy long-term Treasuries? And how can we know in advance of IEF, or any other long-bond proxy’s actual price moves?
- Tracking Treasuries’ volatility through the Merrill Lynch Option Volatility Estimate (MOVE) Index tracking the level of volatility in U.S. Treasury futures.
The MOVE index, calculating risk and uncertainty in the bond market, looks at options prices, which reflect the collective expectations of market participants about future volatility. The index measures the implied volatility of U.S. Treasury across 2, 5, 10, and 30-year maturities usingoptions pricing. It reflects the collective expectations of market participants about future volatility and can be easily accessed in market screens typing ^MOVE or by googling “MOVE INDEX.” By capturing the expected fluctuations in interest rates, the index serves as an early alert “sentiment” indicator of future interest rate movements:
- A high MOVE index value signifies increased volatility in the Treasury market, which may be a sign of heightened market uncertainty or risk.
- A low MOVE index value indicates lower volatility and suggests that market participants expect a more stable interest rate environment.
- A sudden rise in volatility can imply rocky markets and wider daily price swings ahead.
Here is the MOVE Index presented in www.tradingview.com:
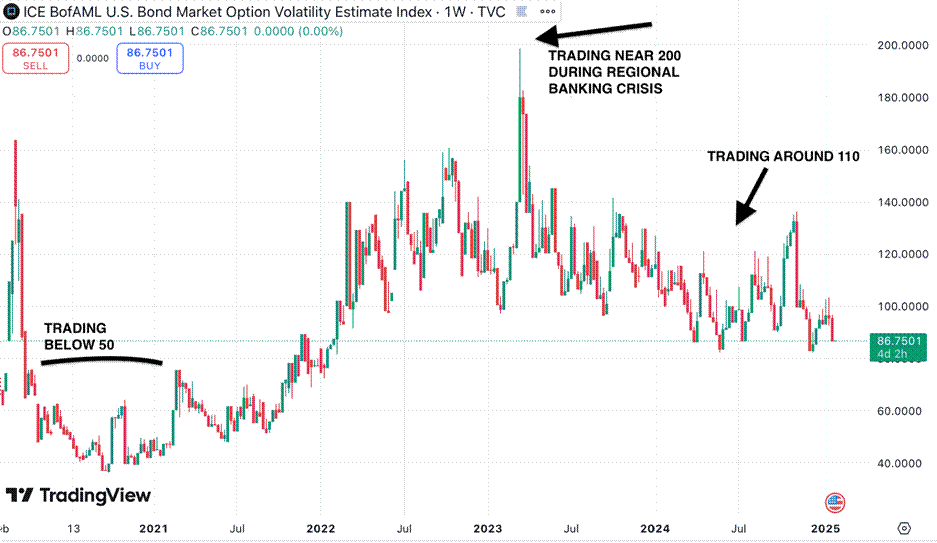
The MOVE index can trade in a wide range, from below 50 in the spring of 2021 to nearly 200 in March 2023 when bank failures sent Treasury yields on a roller-coaster ride over a very short period. The MOVE index, when showing signs of increased volatility by moving higher, may portend cracks appearing in rate stability or even that a rate change era is ahead. It yells out “this may not be the time to invest in longterm bonds!
- Frequently refer to the “live” TradingView chart, above, and/or build your own chart in your brokerage account trading program.
If you are hankering to lock in optimum long-term Treasuries yields, you must first determine timing, that being when yields have probably maxed out (not going higher) and are likely headed lower.
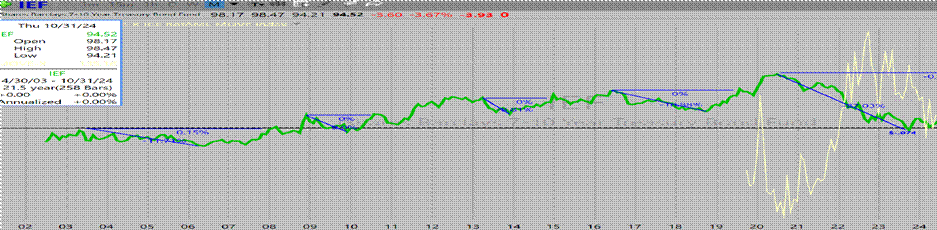
To find that sweet spot, I have built the next chart (below) for two discrete purposes (1) to see/track longterm yields, specifically, the 10-year Treasury’s behavior (using I-Shares’s 7-10 year bond ETF, symbol IEF), over a long enough period of time, and (2) utilizing the MOVE index, symbol MOVE-X, discussed above, as the leading indicator of where bond prices/yields may be headed:
First, let’s look at 7-10 years bonds’ behavior. Does behavior support a buying opportunity?
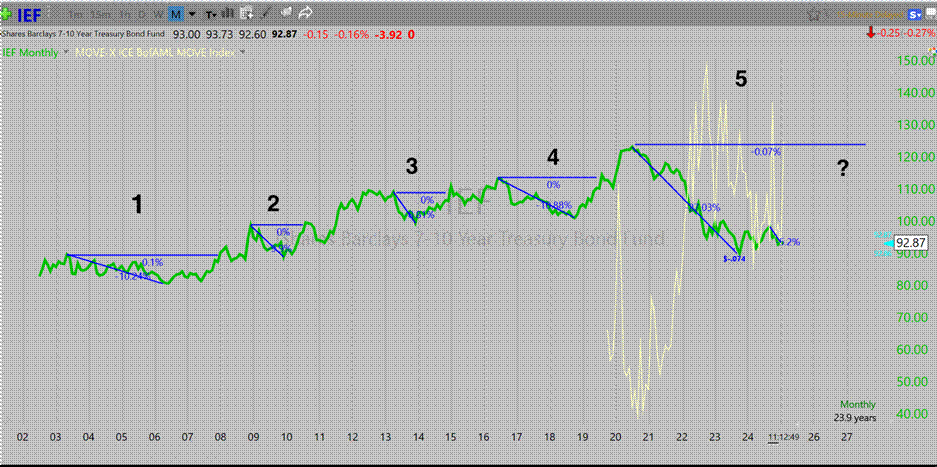
Fundamentally, this chart provides actual past performance of 7-10 year Treasuries and conveys this information:
| Because rates went higher in this time range: if bought on: | held until | your loss was: | ||
| 1 on 7/31/03 | 4/28/06 | -11.71% | ||
| 2 on 12/31/08 | 12/31/09 | -9.9% | ||
| 3 on 4/30/13 | 11/28/14 | -8.81% | ||
| 4 on 6/30/16 | 10/31/18 | -10.88% | ||
| 5 on 7/31/20 | 9/29/23 | -27.03% |
Cumulative periodic losses: -68.33%
The fund, symbol “IEF” holding bond durations of seven to ten years, is an ETF! If you held this fund you would realize the gains and losses actually reflected, day to day, shown above. But remember, we are using this fund’s performance as a proxy for buying and holding an actual 10-year Treasury bond. With that in mind, the question becomes what does this chart tell us, breaking it down with five discrete “performance” moves of our hypothetical 10-year bond holding? Regarding “1” above: If you bought your bond on July 31, 2003 and not selling it on April 28, 2006, although the IEF lost 10.24% right to the time rates moved up, your Treasury gained value! Because of the bond’s “see-saw” behavior discussed above — sending rates/yields down, everyone wants to buy your Treasury. BUT, the opposite becomes true on November 30, 2007: as rates went higher after you bought your Treasury, it starts to lose value. In fact, if you held your Treasury through July 31, 2020, “5” above, (for 17 years) your Treasury would have declined at least 36.29% in value:
¯
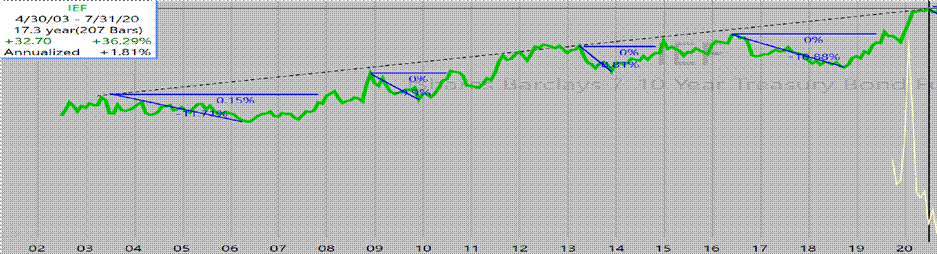
Your long-term Treasury would not have “broken even” until 18 years later, on September 30, 2023:
If you sold before maturity, a worthy goal, your 10-year bond would have been seriously discounted in the secondary bond market. Simply put, following your purchase, this chart teaches the risks of bond value destruction when bonds are not purchased at optimum times. Yes, timing is critically important and, as demonstrated below, optimum bond buying opportunities do not come along very often!
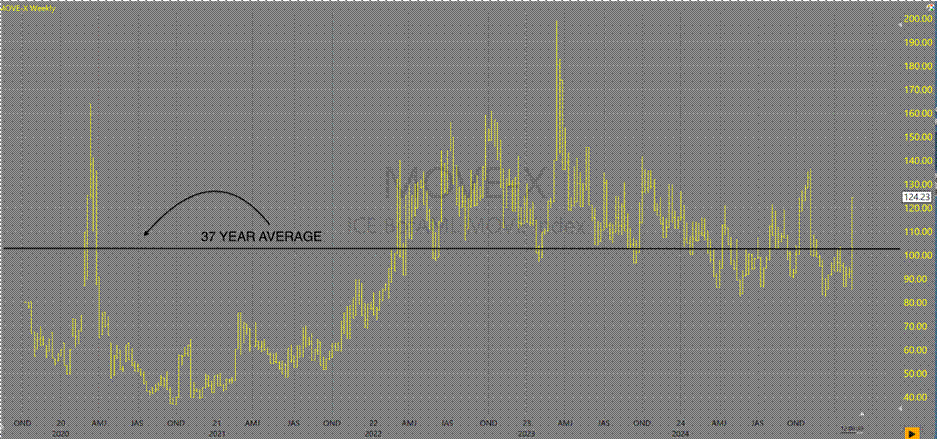
Second, what is the MOVE index (MOVE-X) telling us? It’s the yellow line on our charts. You see that in 2020 it exploded higher, dipped lower in 2021 and resumed a precipitous climb into 2025. As of February 12, 2025 it read 86.57.
This has been MOVE-X’s solid predictive behavior since its creation in 1988:
- The average reading since 1988 has been 103;
- It was 200 in March 2023 when bank failures sent Treasury yields on a roller-coaster ride over a very short period of time; and
- MOVES’s 200-day moving average as of June 2024 was below 120, but it topped in April when yields rallied, and stocks fell after bearish (higher) U.S. inflation data and no subsequent rate cut.
¯
Here is my current MOVE-X beautiful chart reading 124.23 on February 13, 2025:
PART IV
If now is not the “right time” to purchase long-term Treasuries, what then does the “right time” look like?
The “right time” to buy long-term Treasury bonds looks exactly like the happenings imaged on the following charts, buying opportunities in 1980 and 1994:
CHART 1: A LESSON FROM THE FANTASTIC 1980-1981 BOND BUYING OPPORTUNITY
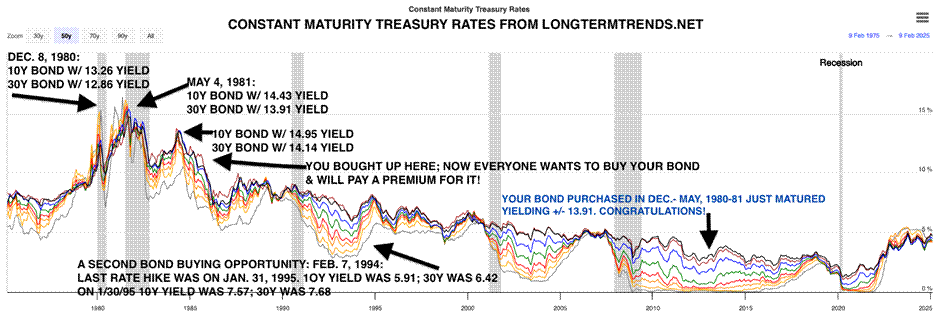
¯
For a moment, focus in on the precise time of the 1980-1981 bond buying opportunity, shown here.
CHART 2, ZOOMING IN ON THE 1980-1981 BOND BUYING OPPORTUNITY:
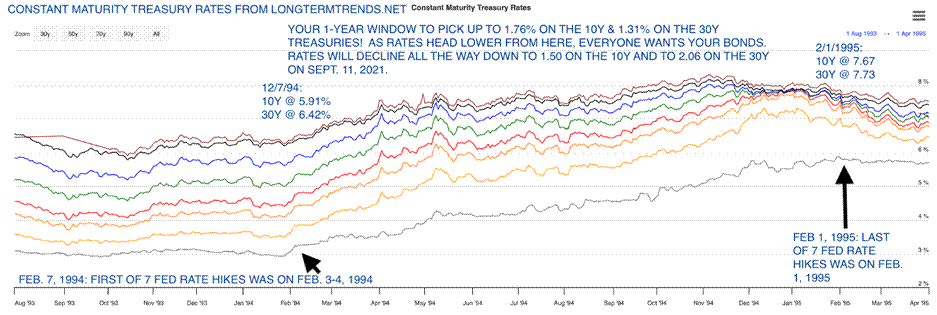
The next “right time” to buy long-term Treasury bonds looks exactly like the happenings imaged on this Chart 3, a 1994-1995 bond buying opportunity.
CHART 3: ZOOMING IN ON THE 1994-1995 BOND BUYING OPPORTUNITY
There you have it – three fantastic bond buying opportunities in the last forty-five years!
In 1985 you actually could have bought a 10-year bond with a 7.67 percent return and a 30-year bond with a return of 7.73 percent (CHART 1) if you missed the first opportunity in 1980. 1980 presented a 10year bond with a 14.95 return and a 30-year bond with a return of 14.14 percent. (CHART 1). Your 30year 1980 bond would have matured in 2010; your $100,000 investment would have paid you a risk-free return of $14,000, exempt of state taxes, when prevailing interest rates were paying 0.15% (federal funds effective rate).
By the way, you can also buy a 20-year bond as well. For research purposes my tables and charts do not include the 20-year bond because it’s use was canceled in 1986 and reintroduced on May 20, 2020. Its rate will fall between the shorter-term 10-year bond and longer-term 30-year bond.
PART V
How Can I know when the next bond-buying opportunity arrives?
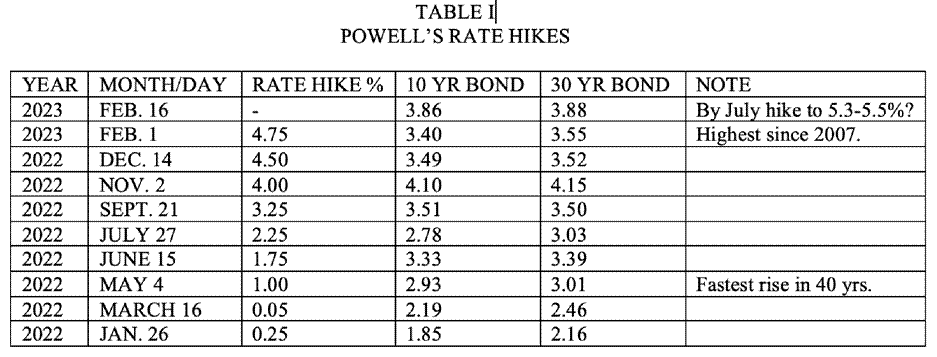
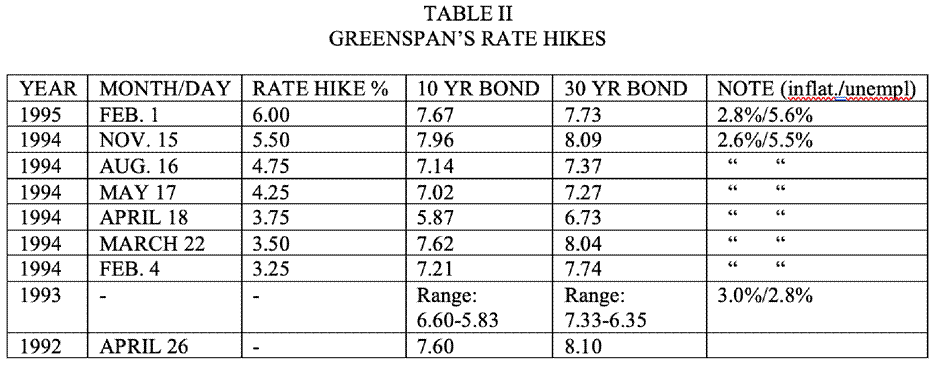
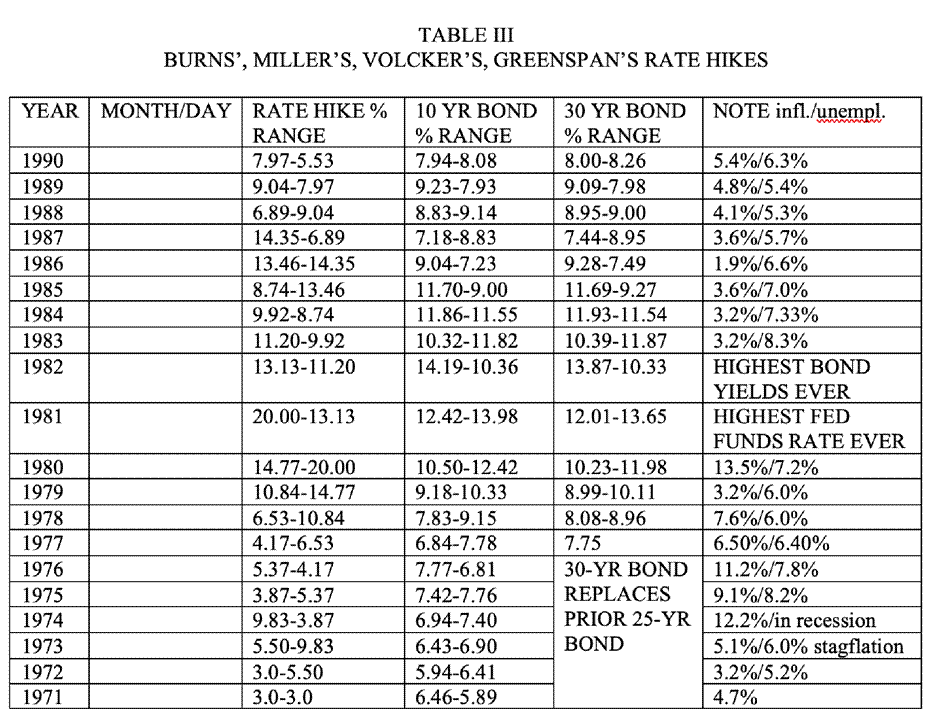
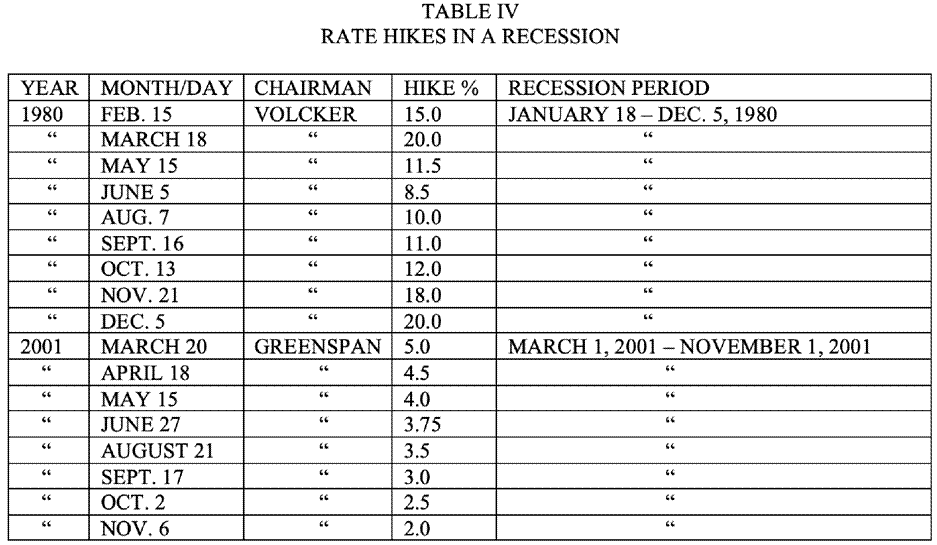
Best way I know how to identify the next bond buying opportunity in decades is to look back in economic history by studying these charts, above, and the corresponding tables found in the APPENDIX, below. Study them closely! They depict the best bond-buying opportunities in the last 45 years, if not over the last century! The Burns, Miller, Volcker, Greenspan era was a blockbuster as Volcker raised the federal funds rate to 20 percent between 1979-1981 to defeat historic stagflation resulting from Jimmy Carter’s four presidential years, an oil embargo, and prior 1970s inflation.
The Greenspan 1993-1995 era less so, but it was still a significant bond-buying opportunity. CHART 3 depicts the period of seven Greenspan rate hikes from Feb. 7,1994 to Feb. 1, 1995, almost exactly a oneyear period. Rates culminated at 7.67 percent for the 10-year bond and 7.73 percent for the 30-year bond. From there, rates precipitously declined steadily over the next 28-years to almost zero. Notice the long, deep rates decline going to -0-% (CHART 1, bottom right). Imagine buying and holding a 30-year bond during the subsequent sub-marginal rates period while your bond is paying 7.73%, maturing in 2025? You would look brilliant! See CHART 1.
But again, how would I have known to buy before or after February 1, 1995 or August 31, 1981? Study CHART 3. Notice that rates started flattening in Dec. 1994. This was your “heads up” – a twomonth alert that rates were leveling off, portending the end of the Greenspan rate hike era. Compare this against the “window” afforded you during the Burns-Volcker era, CHART 2. As in the Greenspan era, you had exactly a 1-year opportunity to get in on his rate hike period, from March 18, 1980 to March 18, 1981, but that market gave you an additional six months, until September 21, 1981 to make your purchase of 15.76 percent for the 10-year bond and 15.20 percent for the 30-year bond before rates leveled off and declined.
Also, notice the high correlation in time between the last rate hikes and the first/initial decline in bond rates: The last Greenspan rate hike to six percent was on February 1, 1995; The rates’ high-point of 7.96 percent for the 10-year and 8.09 percent for the 30-year occurred forty-six calendar days in advance, on November 15, 1994. The last Volcker rate hike of twenty-two percent was on December 1, 1980; The bond rates’ high-point of 15.45 percent for the 10-year and 14.77 percent for the 30-year bond occurred exactly nine months afterward, on August 31, 1981.
That’s the historical 45-year take-away: If the preponderance of evidence is pointing to the last rate hike, start looking at a two-month window to make your optimum purchase before that time; If the preponderance of evidence is uncertain you may have up to 12 to 18 months to do so after the last rate hike. It’s not an exact science and nothing is for certain. Keep a macro-view by focusing on how bond rates are trending: up, down, or leveling off as we see in CHARTS 2 and 3. You’ll then capture over the next 10 or 30 years significant bond values and premiums.
For your financial health and well-being, Dan Steele
¯
A P P E N D I X T O 2 0 2 5 B O N D – B U Y I N G P A P E R
MY COMPLETE DISCLAIMER:
The information provided herein is ONLY for discussion purposes. I do not vouch for or warranty the information/data provided as to truth, accuracy, correctness, appropriateness, or timeliness. I make this content freely and publicly available exclusively for purposes of initiating discussion. All and any information/data may be misleading and wrong requiring your additional research and due diligence. I reserve the right to later disclaim, modify and/or update my rationale and tools without any notice to anyone. I am not licensed by FINRA or any other licensing authority to sell financial products or to give professional financial advice. Your reliance on any and all information provided herein shall not and cannot be interpreted or regarded as advice of any kind. My information/data, right or wrong, is only a part of many factors you must consider when investing assets. When you act to do so, you are on your own.