SUPPLEMENTED & UPDATED ON SEPT. 2, 2019
Dedicated to the long-suffering would-be investor in search of an understandable, User-friendly do-it-yourself equity investment system
by Dan Steele, author[1]
For more than a week now the news media and those not having our best interests in mind – individuals perhaps hoping for an economic recession on President Trump’s watch have been more than happy to publicize the inverted yield curve as portending the coming economic demise.
In support of a coming recession, they rely on the fact that the yield curve inverted on May 22, 2019 and remained inverted over the subsequent 40 days of Quarter 2, 2019 and continued inverted through August 20, 2019 of Quarter 3, a total of 90 days. Because there are 90 days in a financial quarter they erroneously combine Quarters 1 and 2 to get to what they want you to believe, that the yield curve has been inverted for a full quarter. They have to play this semantic falsehood because shorter-term rates must exceed longer-term rates for a discrete full economic quarter (90 days) to avoid many false signals.
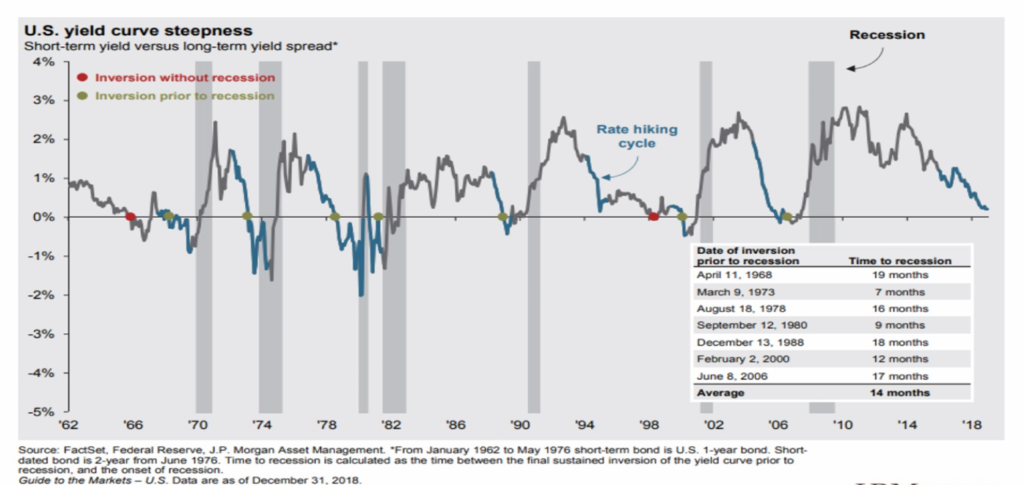
Combining multiple quarterly inversions to get to a constant 90-day period has resulted in many false signals. Also to consider is the question whether or not an investor is better off selling or buying equities on the first day of an inversion? Of 20 inversions, an investor would have been better off selling seven times, but eight times an investor would have been better off buying. In the remaining five times, optimal action was unclear because of market choppiness or small returns. “How to Trade: Two Surprising Facts About the U.S. Treasury Bond Yield Curve” Investor’s Business Daily (IBD) Dec. 4, 2018.
Below find the Federal Reserve Bank of St. Louis’ (A/K/A “FRED”) 10-year Treasury Maturity Minus 3-month Treasury Constant Maturity Chart. The horizontal black line is the point of inversion and the vertical blue lines represent the end of Q1 and Q2.
We are presently about half way through Q3. Note that in no full Quarter so far in 2019 has the yield curve been below the black line. Note also, for these news media and dishonest individuals to calculate 90 days, they have to cross the two blue quarterly lines.

Besides curing the uncertainty of the inversion curve signal through analysis of full quarters, there is a much more compelling reason for only tracking the signal over a full fiscal calendar reported at the end of four quarters. Dr. Campbell Harvey, now a Duke University Professor of Finance came to understand the necessity of linking yield curve inversions with full calendar quarters to establish a meaningful and validly correlated predictive relationship: Rather than relying on stock market expected returns to compare to the bond markets, he utilized Gross Domestic Product (GDP) growth statistics which are only published by the Treasury
Department on a quarterly basis. Dr. Harvey calibrates a yield curve measure to the real GDP measure four times a year. Interim data are projected. GDP growth data establishes real economic quarterly growth (avoiding highly unreliable stock market “expected returns”) and correlates that data with bonds, which can and should reflect the future because they are risk-free (return is guaranteed by the government) with fixed maturities.
For us, the bottom line is that Dr. Harvey’s’s model (unlike the politically charged noise you are hearing from news media and some ill-willed individuals) validly links the slope of the yield curve to real economic growth that actually quantifies data over a full economic quarter about the probability of recession. Dr. Harvey’s model successfully predicted the 1990/1991 recession, the 2001 recession, and the great recession of 2007-2009. There have been no false signals taking you out of an up-trending market.
Do you have easy access to the model’s actual and predictive data? YES! The Cleveland Federal Reserve Bank maintains current data at www.clevelandfed.org/en/our-research/indicators-and-data.aspx. Below, see the present data forecasting only a 35.4% probability of recession in a year:
Highlights
| July | June | May | |
| 3-month Treasury bill rate (percent) | 2.11 | 2.18 | 2.38 |
| 10-year Treasury bond rate (percent) | 2.07 | 2.05 | 2.37 |
| Yield curve slope (basis points) | -4 | -13 | -1 |
| Prediction for GDP growth (percent) | 2.2 | 2.3 | 2.3 |
| Probability of recession in 1 year (percent) | 35.4 | 37.8 | 34.8 |
Now observe the present Yield-Curve-Predicted GDP Growth in chart form. Note that, relying on Dr. Harvey’s model, the orange spread line is just now touching the inverted black line:
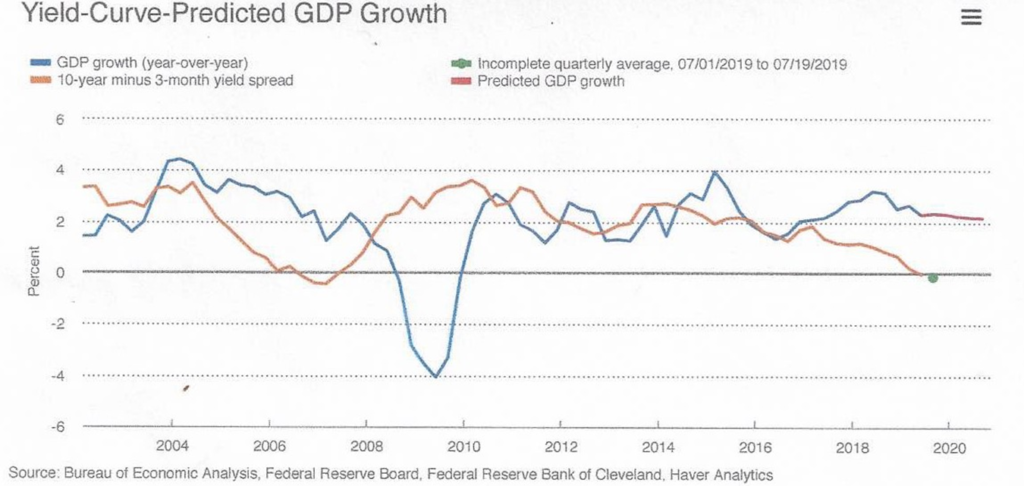
This is in dramatic contrast, thanks to Dr. Harvey’s’s model, to FRED’s raw data (above) which dishonest people rely on to scare you about an alleged immanent recession.
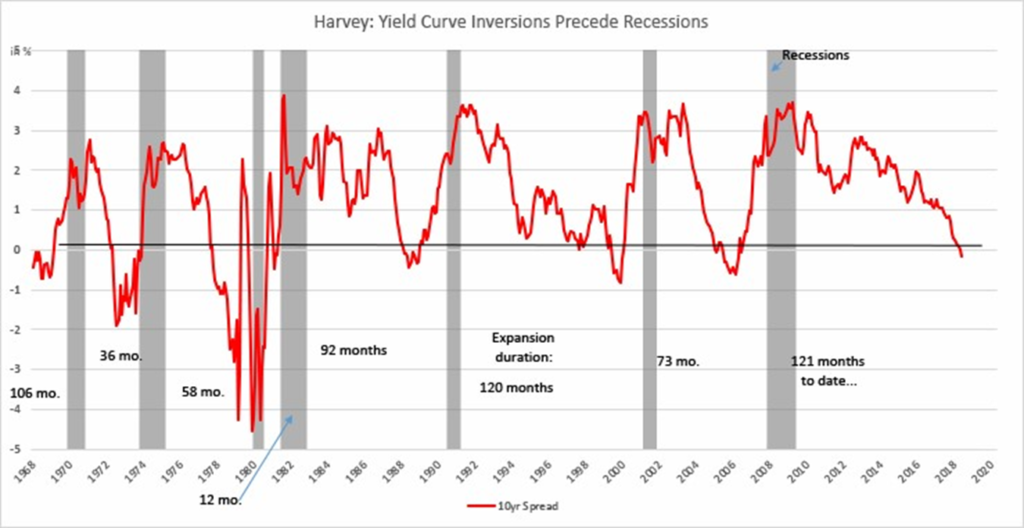
Finally, observing the chart titled “Harvey: Yield Curve Inversions Precede Recessions” the good news is that Dr. Harvey’s model since 1968 identifies meaningful inversions only eight times as opposed to the 20 times it has inverted observing the unfiltered inversion curb. Count, below, the number of times the red graph line falls below the horizontal black line. Coincidently, the number eight corresponds almost exactly to the number of times (seven) you would have been better off buying equities after an inversion as noted in the IBD statistics, above.
AUGUST 31, 2019 FOLLOW-UP
With all the misinformation published recently about the yield curve and it’s purported inversion, I was compelled to publish the foregoing paper to foster a correct understanding of the yield curve and how to legitimately evaluate it for purposes of forecasting recessions.
I referred to the work of Dr. Campbell Harvey, a Duke University Professor of Finance, and his concept of linking yield curve data to Gross Domestic Product (GDP) growth statistics (instead of more unreliable expected equity returns), which are only reported at the end of each calendar quarter. I submitted that this approach established a more meaningful and validly correlated predictive relationship of the data and of future economic recessions. Dr. Harvey identified the link in his University of Chicago dissertation work in 1986.
My August 22, 2019 paper noted that we were only about half way through 2019 third quarter data and that we had to wait until September 30, 2019 to properly evaluate the link. The “forecasted” end-of-quarter data indicated only a 35.4 percent chance of a possible recession. I noticed now, at the end of August, the Harvey forecast has increased to 44.1 percent. This increase in a short period of time encouraged me to put some meat on the bones for you to give some perspective on the quantitative data over time.
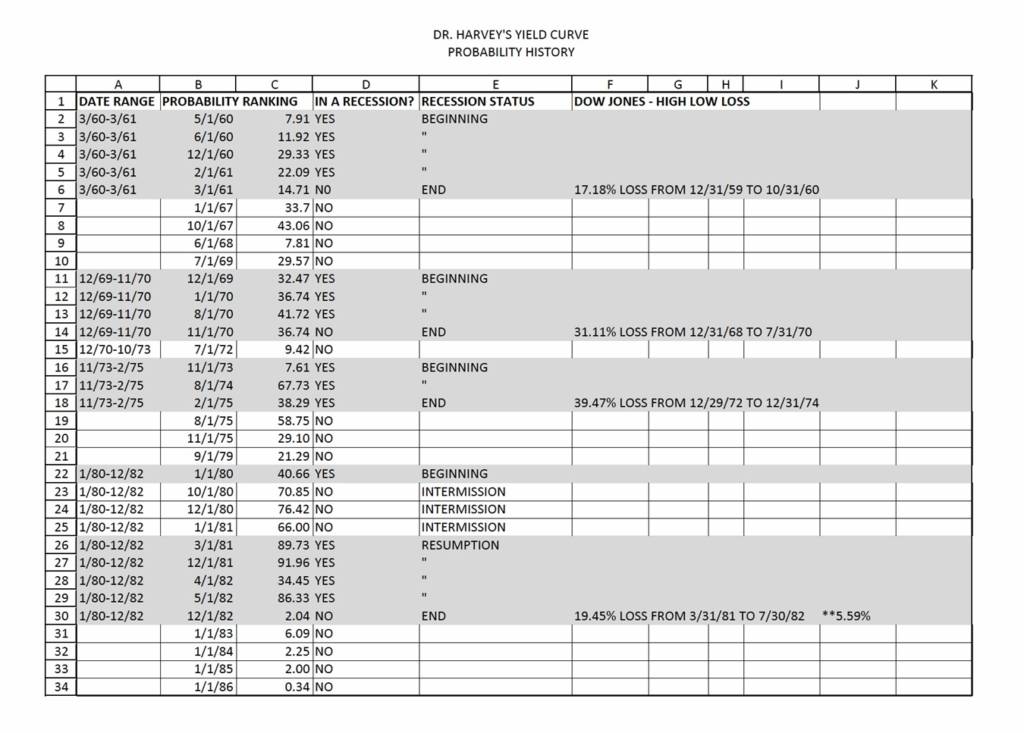
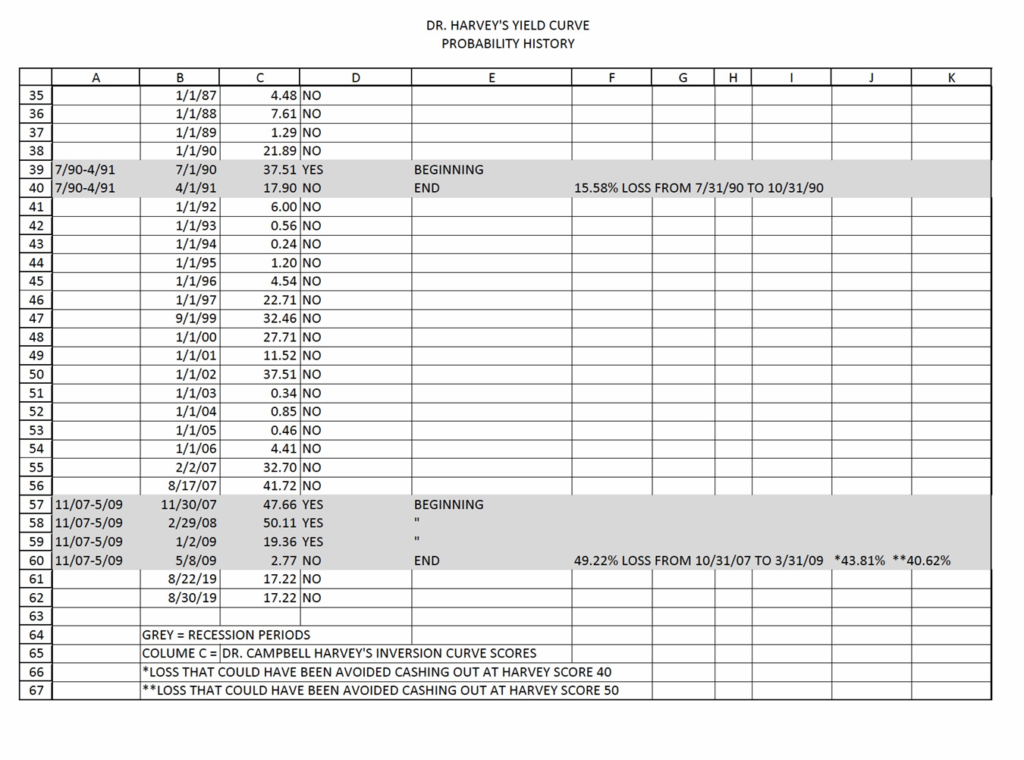
To accomplish this, I referred back to FRED who applies Dr. Harvey’s work on an ongoing basis and reports the results at www.clevelandfed.org/en/our-research/indicators-and-data.aspx. Taking the data back to March 1960, I recorded Dr. Harvey’s inversion probability curve percentages for various dates and recorded with it actual recessionary periods, the greyed out excel rows. I thought this tool would provide a true perspective of the data and it’s application to historical verifiable periods of time. See the spreadsheet at the conclusion of the addendum to my August 22, 2019 paper. Study the spreadsheet for a moment to see what I was trying to accomplish before I attempt to put meat on the bones.
My hypothesis was that I would be able to forecast future periods of recession by observing Dr. Harvey’s probability scores of 40 and 50 percent in advance. In spreadsheet notes, I recorded this data with an asterisk. “*” is a 40 Harvey score and “**” is a 50 Harvey score, all in advance of a recession, not during an official recession. Practically, the idea was to observe these 40-50 probability scores in advance to avoid recessionary equity losses with our hard-earned money.
Amazingly, what I found, as recorded on the spreadsheet, is that the hypothesis resulted in one meaningful correlation relating only to the November 2007-May 9, 2009 “great recession.” Dr. Harvey’s probability score on August 17, 2007, 74 days before the official beginning of the recession, was 41.72 percent. On February 29, 2008, 91 days into the official recession, his probability score was 50.11 percent. If you had cashed out of equities (and bonds) in August 2007 (observing the 41.72 percent probability score) you would have averted a 43.81 percent loss; If you had cashed out of equities (and bonds) in February 2008 (observing the 50.11 percent probability score) you would have averted a 40.62 percent loss. You’re only other valid recession avoidance strategy would have related to the January 1980-December 1982 recession that resulted on top-bottom 19.45 percent loss. If you had cashed out based on Dr. Harvey’s January 2, 1980 probability score of 40.66, you would have avoided only a 5.59 percent loss. Markets had already discounted most losses in advance of the official recession.
Now, the flip side of the coin: Suppose that on October 1, 1967 you observed a Harvey probability score of 43.06 and cashed out of equities. This put you in cash for 26 months, from October 1, 1967 through the recorded end of the recession, November 1, 1970. But the recession was not recorded officially until December 1, 1969. From October 1, 1967 through December 1, 1969 the Dow Jones Industrial Average (DJIA) had a 3.18 percent gain. The December 1969-November 1970 recession had a 20 percent loss.
If you had cashed out on October 1, 1967 pursuant to Dr. Harvey’s 43 percent signal and stayed out of markets through November 1, 1970, you would have missed out on a net gain during that period of 16.82 percent, but would have avoided a 31.11 percent loss during the recession period, resulting in a net loss of 14.29 percent. See the spreadsheet for this period, below. Not a bad result for paying attention to Dr. Harvey’s probability score of 41.72!
Next, observe Dr. Harvey’s probability score of 58.75 percent on August 1, 1975. The next recession came along six months later, on January 1, 1980 and effectively continued until December 1, 1982, a period of 48 months. If you followed Dr. Harvey’s 58.75 score on August 1, 1975 and went to cash, you would have missed out in equity gains of 6.30 percent, but would have avoided a loss of 19.45 percent during the official recession, resulting in a net loss of 13.15 percent. Again, not bad!
No other Dr. Harvey probability scores approached the 40 percent level until November 30, 2007 at which time we were already in the great recession of November 2007-May 5, 2009.
The bottom line is that if you had been following Dr. Harvey’s probability scores since the 1960s and paid attention to his probability scores of 40-50 percent, you would have avoided the December 1969-November 1970 and the January 1, 1980-December 1, 1982 recessions. Avoiding those recessionary losses would have resulted in a net portfolio gain of 48.52 percent. Annualized, this is an additional 1.2 percent return over 40 years.
Every recession is preceded by an inverted yield curve, but not every inverted yield curve results in a recession. There have been nine inverted yield curves since 1960 and seven related recessions:
A seven to nine ratio and treating every yield curve inversion as predicting a related recession has a 23 percent chance of being wrong and, if wrong, you will have missed perhaps meaningful equity returns in an otherwise healthy stock market.
For these reasons, I submit for your consideration, the best course of action would be to follow Dr. Harvey’s probability scores when an inversion to the yield cure has occurred and start paying attention when they reach the forty percent range so you can consider other macro indicators at that time and decide if readjusting equity holdings appears to be a prudent course of action.
I am happy to shed light on some very dishonest media reps and individuals that will side-track your investment goals for their own altruistic purposes which oppose your interests. I am also happy to keep you always on rational and prudent investment pathways.
For your investment health and wellbeing, Dan
[1] As a 37-year trial attorney by trade at the U.S. Department of Justice, now retired from that post, I am a consummate learner of solid and successful do-it-yourself financial investment approaches. Your reliance on my opinions and any information provided herein shall not be interpreted or regarded as personalized investment advice. Under no circumstances does this information represent advice or recommendations to buy, sell, or hold any security. My information/data is only a part of many factors to consider when financially investing.
One Response
Hey Steele, this is a great article about the yield. Thank you, Dan