QUESTION:
IS THE CURRENT U.S. 5% INFLATION RATE, PER BUREAU OF LABOR STATISTICS’ (BLS) JUNE 10 RELEASE, “TRANSITORY” AND SHORT-TERM OR IS IT THE BEGINNING OF A LONG-TERM TREND LEADING TO INCREASING INFLATION CONSEQUENCES?
MY POSITION:
I HAVE BET ON THE LATTER POSITION AND HAVE PUT MONEY BEHIND IT WITH PURCHASES OF A TREASURY 10-YEAR TIPS AND A VANGUARD TIPS MUTUAL FUND (VAIPX). “TIPS” ARE TREASURY INFLATION PROTECTED SECURITIES.
DAN’S COMMENTARY:
Conventional economic theory and Federal Reserve (FED) Chairman Jerome Powell say I am wrong, that sustained inflation will not result from enormous stimulus to our economy through trillions of dollars the FED has infused in the money supply.
One by one, these are their arguments in support of their “debt but no inflation” position and my responses to each:
DEBT BUT NO INFLATION ADVOCATES: THE MONEY SUPPLY MUST HAVE “VELOCITY” TO CAUSE INFLATION WHICH THIS MARKET DOES NOT HAVE.
Look no further than this chart to understand the basis of their “no velocity” argument:
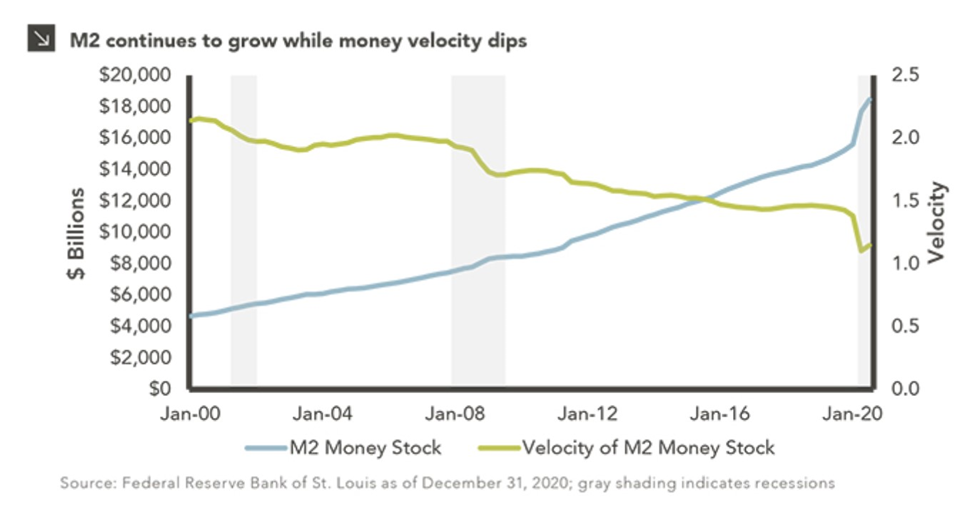
It reflects that while the money supply (“M2”) blue line has increased since 2000, the velocity of money green line has declined and crossed down through M2 in January 2016. The chart data is derived by mathematically dividing the nominal gross domestic product (GDP) by all money in the economy (or monetary base) measured by M2. So, this chart says that the GDP is greater than the measure of how many times money changes hands (velocity) in a year as opposed to being saved and not being spent for goods and services. Conventional economic theory advocates posit that increasing money supply without resulting increased velocity cannot inflate.
I RESPOND THAT THE VELOCITY MEASURE IS A FLAWED INDICATOR AND HAS NOT BEEN A VALID PREDICTOR OF FUTURE INFLATION SINCE THE 1960s.
This chart records the same data points pre and post 1960:
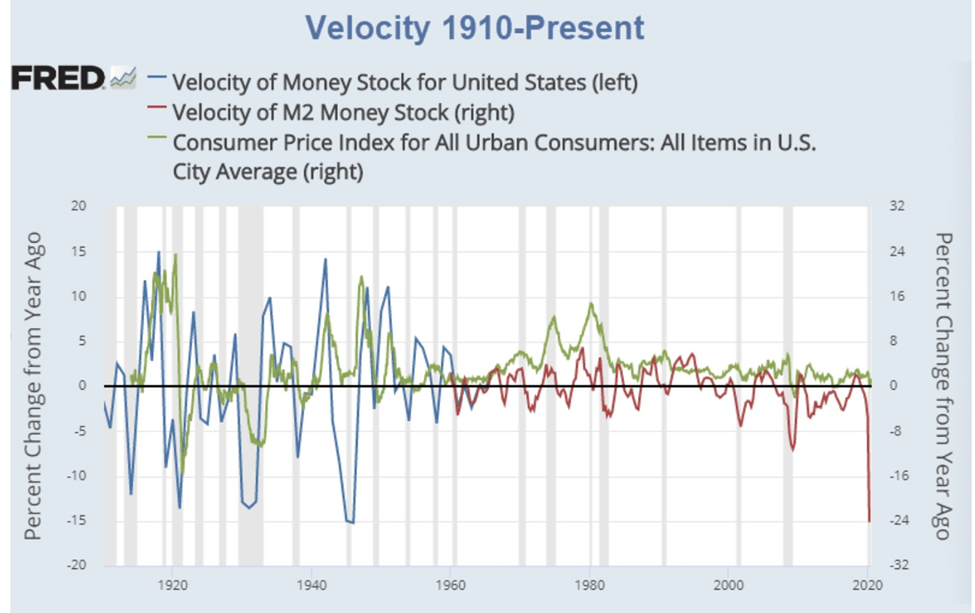
The chart shows that velocity was a leading indicator for inflation when the U.S. economy was on the gold standard. Once we moved to the 60’s and beyond, no correlation at all is evident. Velocity (red line) sharply narrows significantly after 1960. And in 2020, when the FED is infusing trillions of dollars into the economy, velocity tanks by a negative 24 percent from a year ago when you would expect velocity to dramatically move in the opposite direction. In fact, earlier in 2008-2009, during and after the “great recession” the FED disbursed billions of dollars of stimulus and velocity (then M3) declined and continued to do so for the next 12 subsequent years. In the rear-view mirror, inflation also declined to the lowest levels since the 1930s.
If velocity was ever a valid predictor of inflation, perhaps it was when trade between nations required balanced credit and debit transactions between sovereigns so nations could abide by the gold standard from the 16th century on. That link between velocity and changes in price levels broke down by 1971 when President Nixon took the United States off the gold standard as did other nations. Thereafter, gold reserve standards were replaced by central banks regulatory discretion.
The chart data absolutely indicates no nexus or relationship since 1960 between the velocity of money and inflation. Therefore, expect velocity of money to remain constant, near -0- percent year over year (yoy), while inflation increases.
DEBT BUT NO INFLATION ADVOCATES: ALL OTHER PERIODS OF RISING UNITED STATES’ DEBT HAVE NOT RESULTED IN INFLATION.
Current national debt is surpassing that of the World War II era. Lacy Hunt, a “debt but no inflation” advocate in his www.youtube.com presentation (HTTPS://youtu.be/qa5aloy_ays), disingenuously discusses five other periods of “U.S. debt bubble peaks: 1800-2020” each of which he alleges had concurrent deflation or disinflation, but no inflation: “Interestingly, there have been periods of rapidly rising debt in U.S. history, and in none of these cases was inflation a result.” He, however, omits any discussion of two United States’ debt periods that followed World Wars I and II. Each did result in serious inflation.
I RESPOND THAT PRIOR INSTANCES OF RISING UNITED STATES’ DEBT HAVE CREATED RESULTING INFLATION, AS WILL OCCUR THIS TIME.
The costs of WW II were paid for through the greatest U.S. federal debt spending before now. Post WW II debt was 241.86 billion dollars in 1946, the equivalent of 2.87 trillion in today’s dollars.
www.treasurydirect.gov calculates national debt at 269,422 billion dollars on June 30, 1946. Compare this to 3.13 trillion dollars of national debt reported by the federal government as of the end of fiscal year 2020. Inflation did in fact result from WW II spending: American citizens suffered through 9% inflation in each year, 1941 and 1942, and shocking 18% inflation in 1946. Overall, WW II debt was about $3.6 trillion, or $5.47 trillion, in today’s money. (Data from www.thebalance.com).
Although America did not join World War I until April 1917, impending involvement began to drive borrowing in the years before that. Between 1915 and 1917, the country’s borrowing climbed to over 5.7 billion dollars (approximately 112 billion dollars in today’s money) as the country prepared for and ultimately entered that war. And over the course of 1918 and 1919, borrowing soared to 27 billion dollars and would never again end the year below prior $16 billion debt levels. Corresponding inflation followed. One percent inflation in 1914 increased to 12.62% in 1916; to 18.10% in 1917; and to 20.44% in 1918. As the war and corresponding debt spending reduced, so did resulting inflation, coming down to 14.55 in 1919 and inflation further reduced in the subsequent years. (Data from www.thebalance.com).
Lacy Hunt ignores these two post World Wars historical periods when, each time, national debt did result in tremendous inflation. National debt spawned inflation during both periods.
DEBT BUT NO INFLATION ADVOCATES: INFLATION CANNOT RESULT FROM CURRENT NATIONAL DEBT SPENDING BECAUSE U.S. GDP IS HISTORICALLY LOW, STRUCTURAL ECONOMIC WEAKNESS IN LENDING CONTINUES, AND PRODUCTIVITY IS SOFT AND SLOWING.
I agree with Hunt’s beginning proposition: that while expected GDP in 2021 may reach 6.2% the net recovery will effectively be only 1.2% because 2020’s loss, -5%, should be deducted against the recovery percentage. But I disagree with his premise that GDP singularly determines inflating consequences, that you must have a high GDP number to have inflation. I.e., that because 2021’s net GDP is low, effectively in line with the 1998-2020 annual percent of 1.2% when there was little inflation, you should not expect inflation going forward. The question becomes whether you can have low GDP numbers and high consumer price index ratios (inflation)?
/
/
MY RESPONSE IS YES, DEFINITELY.
There are eleven years in the economic history of the United States that we had high inflation notwithstanding a low or negative GDP. Those instances are reflected in the table below along with contextual notes:
YEARS OF HIGH INFLATION WITH LOW OR NEGATIVE GDP
| YEAR | INFLATION YOY (%) | GDP % | NOTES |
| 1946 | 18.1 | -11.6 | FEDERAL BUGET CUTS WITH COLD WAR SPENDING |
| 1947 | 8.8 | -1.1 | |
| 1967 | 4.50 | 2.7 | VIETNAM WAR |
| 1970 | 5.00 | 0.2 | RECESSION |
| 1974 | 8.00 | -0.5 | ECONOMIC CONTRACTION FROM PRIOR GDP OF 5.6%; WATERGATE; STOP-GAP MONETARY POLICY |
| 1975 | 4.75 | 0.2 | |
| 1980 | 18.00 | 0.3 | FROM PRIOR YR EXPANSION (3.20%) TO JAN. CONTRACTION/RECESSION; REAGAN TAX CUT; 1983 EXPANSION (4.6%) |
| 1981 | 12.00 | 2.5 | |
| 1982 | 8.50 | -1.8 | |
| 1990 | 7.00 | 1.9 | RECESSION |
| 1991 | 4.00 | -0.1 | FED LOWERED RATES |
So, as shown, you can have high inflation with a low or negative GDP. Note also that when you have high inflation with low or negative GDP occurrences, they typically last for two years, but the 1980 event lasted for three years. Compare this to longer periods of sustained inflation: 1965 through 1990, 26 years in which inflation stayed above 4.25%. During a four-year interim period, from 1978 through 1981, we had double digit inflation. It was blamed on poor FED fiscal management along with an external event – an oil embargo precipitating very high energy prices in the United States. Will 2021 inflation endure for one, two, three years or longer? How high will inflation go?
Hunt’s ancillary arguments for low inflation going forward are suspect as well. In a nutshell, he posits that weakness in bank lending since 1990 and soft and slowing national productivity combined, will ward off future inflation. He errs on both points.
First, bank lending has not recently been weak from a short-term viewpoint. Figure 3, below, from the FED Board of Governors illustrates the makeup (“decomposition”) of recent bank lending growth processes:
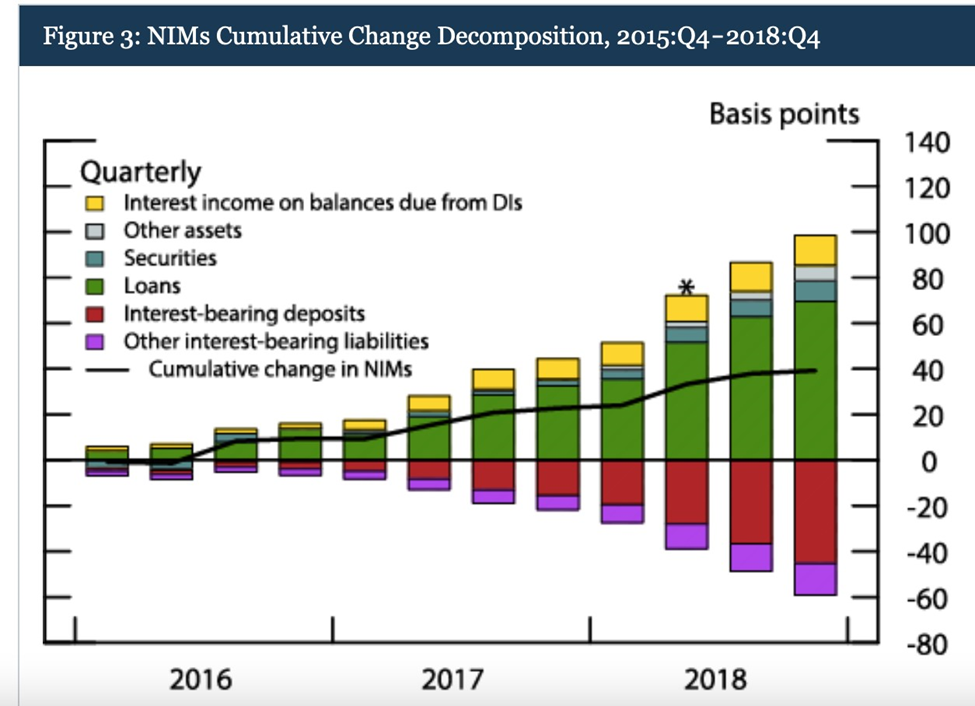
The vertical bars represent the cumulative contributions of each asset and liability type to total changes in net interest margins (NIMs). NIMs are simply a measure of a bank’s or the entire banking sector’s profitability. The green-shaded portion of the bars indicate that loans have been the biggest positive contributors to NIMs, especially loan types such as commercial and industrial loans, which tend to have floating interest rates that adjust upward more quickly with changes in the federal funds rate than do other types of longer-term fixed rate loans such as home mortgages. Figure 3 also shows that securities and excess reserves, the blue and yellow portions of the bars have contributed positively to the cumulative change in NIMs but by far less than the contributions from loans. The take-away is that quarter to quarter, from 2016 through 2018, banking profit margins have increased.
The chart, below, plots the average NIMs for all U.S. banks since 1984 alongside with the one-year constant maturity yield on U.S. Treasury securities. This yield represents the general level of short-term market interest rates.
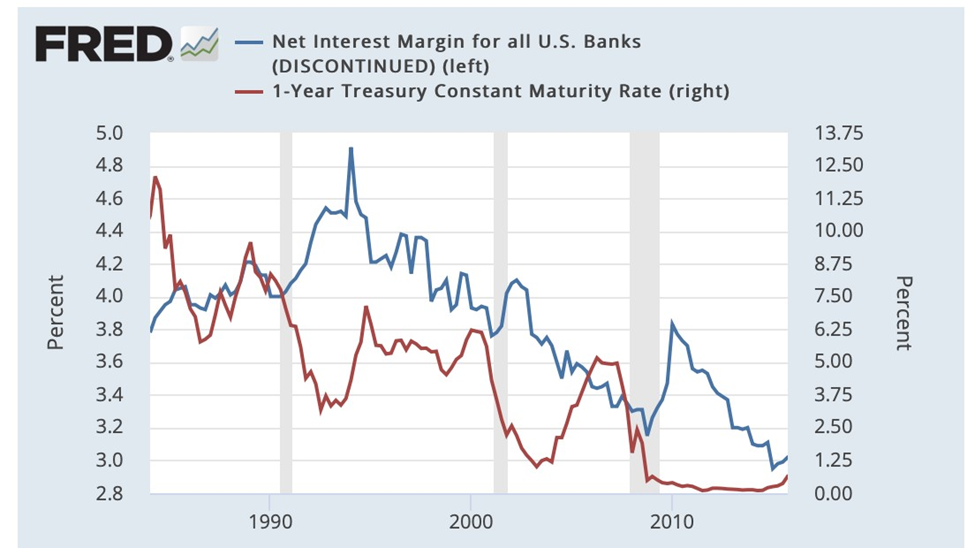
Both series have been trending down. However, over short periods of time, a year or two, NIMS tend to move opposite of market interest rates. For example, large declines in the yield on Treasury securities during the recessions of 1990-91, 2001 and 2007-09 coincided with substantial increases in net interest margins. As market interest rates continued to fall after the recessions, however, net interest margins eventually also fell.
Hunt concludes that this continuing downward sloping, long term, transactional relationship is antiinflationary.
The FED’s guidance is that the period since 2010 has been somewhat unusual in that net interest margins have continued to fall while the yield on one-year Treasury securities (and other market rates) has been relatively stable at historically low levels. Over this period, bank funding costs have been exceptionally low, but the average rates of return (interest on loans) on bank assets have continued to fall. Loans made in the past at relatively high interest rates have been replaced by new loans with lower interest rates as well as by low-yielding reserves and securities.
Thirty years of current historically low interest rates comprise a cycle in which banks are required to loan money with correspondingly lower lending rates. The banking business model of “lend long and borrow short” inverses so that as more loans get paid off in such a cycle, banks are lending short and borrowing long. Over time, however, net interest margins fall as loans are repaid or renewed at lower interest rates. Thus, the FED’s wisdom is medium to long term net interest margins adjust and become largely unrelated to the general levels of market interest rates. I submit that the FED’s exceptionally low interest rates policy paid on government obligations has as much to do with the NIMS banking imbalances as anything else.
Hunt’s debt but no inflation stance based on reduced NIMS, even to the point of bank’s not lending, is misplaced pursuant to the FED’s own inquiry on the subject and should be discounted.
Second, in support of his debt but no inflation position, he posits that U.S. productivity has transitioned to fundamentally less income producing industries. I.e., to a less profitable service economy; 2020’s creation of “zombie companies” – unproductive companies kept alive by ultra-low rates; and demographics – an aging and declining population.
Hunt’s often referenced arguments in support of a generally weakening economy fly in the face of Milton Friedman’s famous quote – inflation is “always and everywhere a monetary phenomenon.” It means that while money supply growth (recently through stimulus spending) is a requirement to inflate, there must also be a demand that exceeds supply.
During the pandemic, surely everyone has been touched by a shortage of goods they wanted but were unavailable because demand exceeded the production of those products. At the outset of the pandemic, it was reflected in a shortage of paper supplies (toilet paper); currently it has been a shortage of construction/building supplies (lumber and paint). Today I have learned of nation-wide gas shortages leading up to the 2021fourth of July weekend because of supply/demand imbalances. Monetarily, this phenomenon is identified as an “output gap.” The gap is wide but has been closing. So, the FED has decided to let inflation rise today rather than tighten quantitative easing and/or raise interest rates. But as a monetary matter, will the FED err on the side of easy money being too easy for too long? That may result in sustained inflation over a long period of time. As discussed above, flawed FED policies in the 1960s resulted in inflation above 4.2 percent for 26 years.
Hunt’s commentary about the U.S. economy slowing (we are a service economy with unproductive “zombie” companies) in support of his “debt but no inflation” position essentially translates into us being an importing nation. However, the United States economy is still a relatively closed economy with only about 15 percent of goods and services we consume coming from abroad. Although that statistic was only 4 percent in the 1970’s when inflation ran rampart, it’s an unfair comparison today. U.S. importing goods, for the most part, are now competitively priced in far more open global markets than before. Eastern Europe’s recent participation in global markets, as well, has increased labor supplies dampening wage growth in the United States. But the point is that the output gap is narrowing and may close, bringing the U.S. to full monetary economic production from a consumer perspective, although maybe not from a U.S. employment perspective. The fact is that our resumption to a “hot” economy has real upside risk of inflation, especially if the FED continues dovish policies longer than it should or if another “black swan” event, like the pandemic, robs the FED of its discretion to act as it should. To some extent, this is already reflected in the sharp rise in the compensation investors are requiring for inflation risk.
Lacy H. Hunt, Ph.D, former Senior Economist of the Federal Reserve Bank of Dallas and now Executive Vice President of Hoisington Investment Management Co., has given his best arguments in support of his “debt but no inflation” position. If you, like me, have bet on upcoming rising inflation and have read this paper, confidently hold to your position knowing that you have rationally analyzed this nuanced and complex inquiry with one of its best “debt but no inflation” proponents on the other side.
My next paper in this space will discuss how to invest in inflationary and deflationary environments. Each requires very different investment approaches.
Thoughtfully yours for your financial health, Dan Steele