QUESTION:
WITH BONDS PAYING ALMOST -0- RETURNS BEFORE INFLATION LOSSES AND WITH THE RISK OF LOSING PRINCIPAL DURING THE HOLDING PERIOD, WHY IS TODAY A PERFECT TIME TO INVEST IN THE U.S. GOVERNMENT’S 20 YEAR TREASURY BOND BY PURCHASING SHARES TLT ETF?
SUMMARY:
READ THIS ARTICLE CAREFULLY IN ITS ENTIRETY. I’LL EXPLAIN IN THE FIRST PART THE FINANCIAL/ECONOMIC BASIS OF THE SUBJECT AND THEN IN THE SECOND PART YOU’LL UNDERSTAND LANCE ROBERTS OF WWW.REALINVESTMENTADVICE.COM WHEN HE STATES:
With the Fed now set to hike rates and reduce their balance sheet to slow economic growth, not to mention geopolitical risk with Russia, the demand for safety will return. If Goldman Sachs and Morgan Stanley are correct, we suspect yields will fall toward previous lows by the end of 2022, suggesting an 11% return on bonds.
My Introduction to the Subject:
A bond is what you receive when you lend money to a borrower. You, as lender, and your borrower determine a rate of interest you’ll receive based on the borrower’s project[s], relative risk, and the prevailing interest rates. Buying bonds now, with almost -0- interest rates means that when other lenders/ borrowers come along, rates may rise and your bond, if sold before it matures at the date you both agreed on, will be worth less than subsequently issued bonds. In that case, why in the world would you want to be buying bonds now?
Answer: you aren’t necessarily adding bonds to your allocation now for return alone. You are doing so to keep a portion of your assets, for the most part, safe until expensive equity markets correct. At that time, you will rebalance equity holdings by selling some of these safe bond investments and putting the money back into stock markets. Further, assuming relatively safe bond purchases with terms less than 10 years duration, even though you are subject to bond market risk, if you hold to maturity, you’ll get your principal back with yield paid along the way.
My Commentary:
The inquiries that follow will guide you through bond basics so you can fully understand Lance Roberts rationale and his recommendation to his clients to buy the TLT ETF at a brokerage or mutual fund company:
Point 1: During the bond’s holding period, before maturity is reached, the underlying price is subject to interest rate fluctuations. Interest rates adjust up and down and are influenced by these economic factors: growth/decline, wage growth/decline, and inflation/disinflation/deflation. This “bond see-saw” clearly portrays the interest rate/bond price relationship:
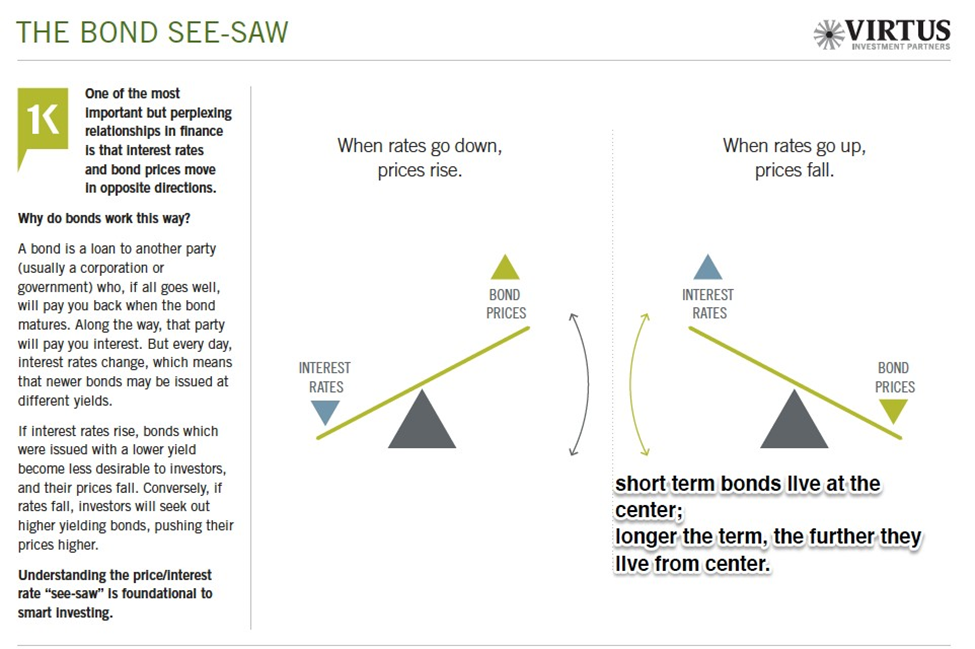
Which see-saw are we riding now? Well, interest rates, our cost of borrowing money, are increasing and will increase further as the Federal Reserve tries to quell 7.5% inflation. On the other hand, interest rates are so low that investors have been piling into riskier “high yield” bonds for better returns – a move to receive higher interest payments. So, because interest rates are rising, existing bond prices must, and are falling. People want newly issued bonds paying higher interest and not the lower paying bonds issued when interest rates were lower. This is the “inverse” relationship – we are riding the saw-saw on the right! With interest rate returns so marginal and existing fixed income rates going lower, why would you ever buy bonds now? Well, “high” and “low” are relative terms that can only be defined in a larger context which we’ll call “the world of bonds,” Point 2. That context should provide the “deer in the headlights” moment to understand why we are discussing this at all. It was for me.
Point 2: What’s going on in the world of bonds? Well, it may resemble Japan in our universe. Japan had a prospering economy, but a 1990s real estate collapse there and abroad (Japan was going to own everything in NYC) brought that expansion to an end. By 1997, its 10-year bond yield dropped below 2 percent. 25 years later, rates went negative. Nobody saw this coming or predicted its long-term effect on Japan’s bond market that was driven by “overbought” interest rates.
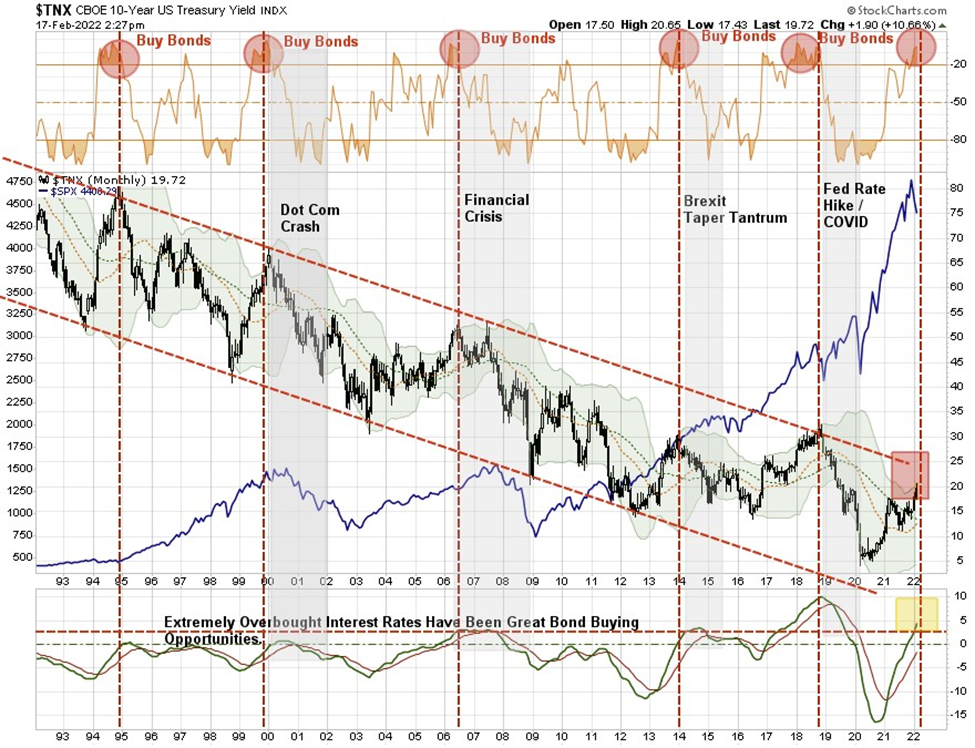
Lance Roberts’ “$TNX” chart, below, reflects “extremely over-bought” interest rates here now. $TNX is an index based on 10 times the yield to maturity of the most recently auctioned 10-year Treasury note. It’s a good “general” gauge of the current interest rate environment. His $TNX chart also documents that in the last 30 years, there have been only five other equivalent bond buying opportunities in 1995, 2000, 2006, 2014, and 2019. As a consequence of overbought interest rates, other evidence of bonds’ extremely oversold condition is the JP Morgan High Yield Index (U.S.). It’s NAV was negative 3.68% (YTD) on February 18, 2022. The Index has produced negative returns in only four years since 1980. It’s downturn in 2008 was a huge a 27% drop. The others were relatively modest: 6% in 1990, negative 2% in 1994, and negative 6% in 2000. Finally, the Barclays Aggregate U.S. Bond Index which holds Treasuries, corporates, and other investment-grade U.S. bonds has gained ground in 32 of the past 38 years. The one down-year was 1994 when it lost only 2.92%. In 2018, its “safe” bond yield rose to almost 3% causing forecasters to predict a bond market (especially corporate) bursting bubble. The “risk-free”10-year Treasury bond with a 1.944% yield on February 22, 2022 has increased by 172 basis points since July 2016 when its yield was 1.50%
This is and has been for a long time an extremely over-bought interest rate-driven market. Rather than anticipating more stellar returns (as small as they seem to be) going forward, investors would be wise to plan for smaller interest rate returns. If interest rates from here come down to historical levels, bond prices will go up.
What does this mean for our analysis? Yes, the interest rate seat on our see-saw is indeed air borne and the bond prices seat is ground bound. But taking into consideration our long and short term knowledge of interest rate behaviors, discussed herein, tells us that our see-saw bonds seat is about to go sky bound because fiscal bubbles (in interest rates) can and do burst or at least rein-in market expectations. As that happens, we expect our see-saw interest rates seat to go earth bound, as interest rate risk reduces, especially for the 6-8-10 month investment period that Lance Roberts projects. Our see-saw becomes the one on the left.
Point 3: To bring further perspective to our consideration it’s important, thinking about this, not to magnify numbers/percentages out of proportion. For our purposes, we are not speaking about huge, macro changes of interest rates, but only a point or two or in fractional amounts. As demonstrated in this chart, such macro changes normally only occur over multiple decades:
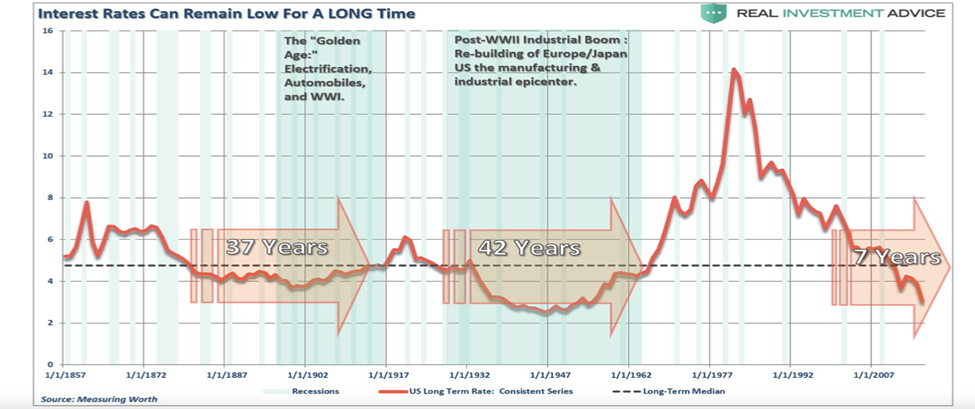
Note the prior two lengthy historical periods of low interest rates of 37 and 42 years. Note also that we are only seven years into this current period of secular low interest rates. Yes, interest rates are rising and yes, prevailing bond rates are falling as newly-issued bonds pay higher interest. This macro perspective, however, gives historical context of limited risk, both in price and duration, of Lance Roberts’ recommendation.
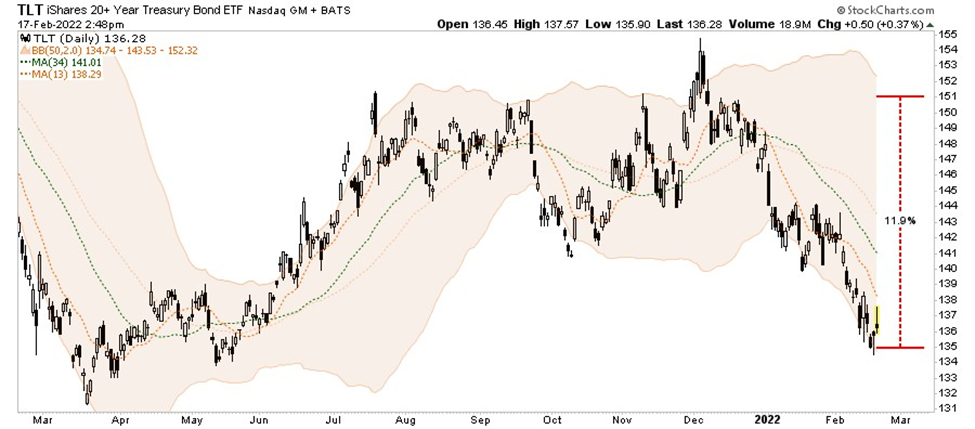
Here, Roberts forecasts an 11.9% price return (TLT’s chart, below, right side horizontal dashed line) if the 20-year Treasury appreciates just 0.5%, to 2.80%, now paying 2.30% (Friday, 2/18/22) over the next 6-8-10 months. This projects a TLT price move from 138 to 153 ($15.00) per share.
Lance Roberts in his own words and analysis:
Buy Bonds For Capital Appreciation & Protection
Most people view bonds as an income-only investment. With yields low, why own bonds? However, there is another aspect to bonds: capital appreciation.
In our portfolio management process, we buy bonds for three reasons:
- Capital appreciation – the same reason we buy equities
- Total return – interest income plus capital appreciation
- Risk reduction – lower volatility asset to offset higher volatility assets (equities.)
If you start thinking about bonds as an “equity,” the analysis changes from an income strategy to a capital appreciation opportunity.
Currently, using a monthly chart, treasury bonds are at a very critical oversold juncture. Historically, when bonds were this oversold such coincided with a financial event or recession. Such is not surprising given, as noted above, the impact of higher rates on a highly leveraged economy.
Since interest rates are the inverse of bond prices, we can look at this long-term chart of rates to determine when bonds are overbought or oversold.
- In 2018, rates slid lower as the realization that Fed rate hikes would negatively impact economic growth and financial stability.
- As 2019 progressed, the yield curve inverted pushing rates lower as investors sought safety.
- In March of 2020, as the pandemic raged, the demand for safety caused rates to plunge to record lows.
Historically, bonds are the beneficiary of a “risk-off” rotation during market downturns. Such not only provides a return but reduces overall portfolio volatility.
With the Fed now set to hike rates and reduce their balance sheet to slow economic growth, not to mention geopolitical risk with Russia, the demand for safety will return. If Goldman Sachs and Morgan Stanley are correct, we suspect yields will fall toward previous lows by the end of 2022, suggesting an 11% return on bonds.
Bonds could outperform stocks this year.
Should you buy TLT, Lance Roberts reminds us that like equity trades, you must manage this trade as you would manage an equity trade utilizing chart and technical tools to set entry and exit points.
Closing remarks: My struggle to communicate this subject matter in an understandable context has been challenging as the concepts necessarily rise to theoretical learning of intense subtlety. Now I know why Wall Street aficionados say that fixed income (bond) investors are the smartest people in the room. The bond market’s capitalization (size) is actually ten trillion dollars more than the stock market (40 trillion versus 30 trillion dollars). I appreciate, as well, your effort to get a handle on this subject matter and, if appropriate for you after further self-inquiry, to buy some TLT shares. As I am learning the subject matter myself, the sole purpose of this paper is to communicate concepts for you to think about in conjunction with your own education and due diligence. I’m not licensed by FINRA or any other licensing authority to sell financial products or to give professional financial advice. Therefore, any information provided herein cannot and should not be interpreted or regarded as personalized investment advice or recommendations to buy, sell, or hold any security. You are on your own when it comes to your investing.
Thoughtfully, for your investment health, Dan Steele
One Response
Really like the see saw article