QUESTION:
DOES MILTON FRIEDMAN’S OLD LICENSE PLATE TELL US THE MONTHLY FUTURE 2021 RATE OF INFLATION AND BEYOND?
SUMMARY:
READ THIS ARTICLE AND THE NEXT TIME SOMEBODY ASKS YOU WHAT DID MILTON FRIEDMAN MEAN WHEN HE SAID THAT “INFLATION ALWAYS AND EVERYWHERE IS A MONETARY PHENOMENON” YOU CAN EXPLAIN TO THEM THAT:
Monetarists assert that the empirical study of monetary history shows that inflation has always been a monetary phenomenon. The quantity theory of money, simply stated, says that any change in the amount of money in a system will change the price level. The general price level is related to the level of real economic activity, the quantity of money and the velocity of money.
DAN’S COMMENTARY:
Milton Friedman never was a Federal Reserve Chairman. In fact, he challenged the usefulness of the Federal Reserve System (FED). He vehemently opposed the FED’s fiscal spending policies, now referred to as quantitative easing (QE2). He discerned that notwithstanding the FED’s spending, the money supply would only grow at a rate commensurate with the growth in productivity and demand for goods; that excessive expansion of the money supply by the FED is inherently inflationary; that FED monetary implementors should focus solely on maintaining price stability. He received the Nobel Prize for Economic Sciences in 1976.
Regarding the dangerous inflation explosion of 2021 and beyond, Milton’s license plate (circa. 1977) is prescient for us today:*
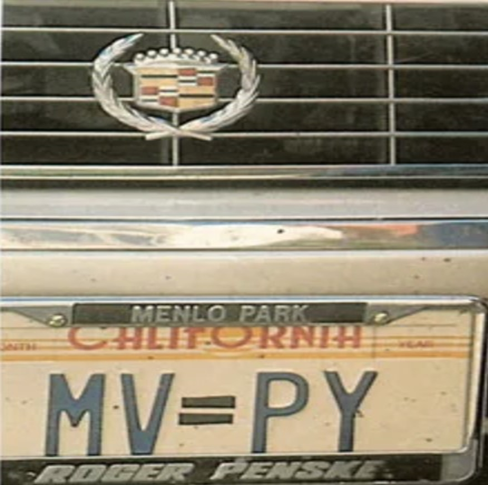
M x V = P x Y is Milton’s “back-of-the-envelope” equation that tells us the rate of inflation we are living with in 2021 and in future months and years. Let’s read it:
We’re solving for M, which is the quantity of the money supply, FED’s “M2”
V is the “velocity of money” (how often ((frequency)) money changes hands)
P is price level (the FED’s “inflation target”)
Y is the real economic output (real gross domestic product ((GDP))
Note: Q data can be substituted for Y to arrive at the same result.
The following are the numeric inputs and the sources of monthly data that you can access online on an on-going basis to follow the inflation problem:
V, the velocity measure comes from the Center For Financial Stability, reported monthly.** Simply obtained by googling “CFS Divisia M4” It reports that “CFS Divisia M4”, including Treasuries (DM 4) – the broadest and most important measure of money grew by 4.5% in June 2021, over the preceding year.
P, price level, is most often measured by the consumer price index (CPI) as a percent monthly. Go to www.bls.gov tab “economic release” It reports that “the all-items index rose 5.4% for 12 months ending July 2021.”
Y or Q, real GDP, is a macroeconomic measure of the value of economic output adjusted for price changes (i.e. inflation or deflation). This adjustment transforms the money-value measure, nominal GDP into an index for quantity of total output. GDP is total output, i.e., closely approximates total spending: the sum of consumer spending, investment made by industry, excess of exports over imports, and government spending. Due to inflation, GDP increases and does not actually reflect the true growth in an economy. That is why the GDP must be divided by the inflation rate (raised to the power of units of time in which the rate is measured) to get the growth of the real GDP.
Go to www.bea.gov > “Data Tab” > “gross domestic product (GDP)” Dept. of Commerce, Bureau of Economic Analysis reports: Real gross domestic product (GDP) increased at an annual rate of 6.6% in the second quarter of 2021.”
Armed with this monthly data, you can go to www.fxsolver.com and search for its equation of exchange calculator and simply plug in the data percentages to solve for M.
Plugging this data into Milton’s equation to quantify for M (quantity of money) will calculate the inflation threat in September 2021 and month to month thereafter with the then current inputs:
P or price level (FED’s inflation target) is: 5.4
Y or real GDP is: 6.6
V or money velocity is: -4.5
M or total money supply = 7.9% Milton’s anticipated annual inflation rate.
Re: P, price level, CNBC reports that the June CPI increase to 5.4% from a year earlier is the largest jump since August 2008, just before the worst of the financial crisis. Economists surveyed by Dow Jones had been expecting a 5% increase. Another way to think about M, 7.9%, is to compare it to the FED’s goal of an annual inflation target of 2% with the money supply growing annually at 6% since they assert that this inflation is only “transitory.” But with inflation growing at 7.9%, what we solved for, the FED’s own annualized inflation target (2%) itself must almost triple to 5.4%, but with only a meager pickup in GDP of 0.6%. Does that sound like stagflation (inflation with no growth)?
Looking at just the M2 money supply, Professor Hanke, introduced below, states in the Wall Street
Journal (July 20, 2021) that since March 2020 M2 has been growing at an average annualized rate of 23.9% — the fastest since World War II. This is four times greater than the FED’s target rate of 6%. He opines that after 24 months, “inflation is baked into the cake, and it’s likely to persist.” He projects that by the end of 2021, the year-over-year inflation rate will be at least 6% and possibly as high as 9%. Finally, with reference to my prior paper rebutting the “no velocity, no inflation” advocates, Prof. Hanke says this:
“While velocity did collapse at the onset of Covid, it’s on track to pick up until the end of 2024. Consequently, velocity will grease the monetary wheels. That’s why inflation might hit the high end of our forecast range.”
Finally, a word about the thinking/rationale behind Milton’s license plate formula. Popular misconceptions abound that increased economic growth, by itself, causes inflation to increase regardless of FED spending (QE2) and that higher prices for goods and services along with higher wages will necessarily result. That is what FED officials mean when they talk about “transitory” inflation. But such thinking wrongly concludes that higher growth, by itself, leads to higher inflation. It’s not true! De facto higher growth of the money supply is what leads to such higher inflation, not higher real growth by itself. Milton’s license plate formula precludes that as a statistical/mathematical fact. This supinely important point that growth alone will not cause inflation was the subject matter of Milton’s address to the
American Economic Association in 1967. In Milton’s license plate formula, the rate of growth (price ((P)) must decline if spurred only by economic growth and no FED spending. That is because without FED spending, more goods are produced for money to “chase” and that actually creates downward pressure on inflation. It’s pure or real growth!
Let’s now apply this narrative to prove that Milton’s formula works as an inflation/deflation predictor: If money supply grows at 7% a year (no FED spending) and velocity is constant and if annual growth is 3%, inflation must be 3.9%. If, however, economic annual growth rises to 4%, inflation falls to 2.9%. Now compare these numbers against our current-day inflation (above) with FED spending of 7.9%. That’s why “inflation always and everywhere is a monetary phenomenon” meaning that it is only precipitated by the FED infusing dollars into our “real” economy.
Ftnotes:
*Milton was pulled over by police for using a fraudulent license plate: The character = was not a vanity plate option in California. He responded: damn, those neighborhood kids are screwing with my license plate again! Go back and take a closer look at the plate. In Palo Alto, CA, all those smart kids must be monetarists. The take-away: Unlike keynesians, monetarists (believing that controlling the supply of money that flows into the economy while allowing the rest of the market to fix itself) have a great sense of humor! God bless Milton Friedman.
** Why go to a private organization and not a government entity for this critical information? Steve Hanke, economic advisor to President Reagan and now an applied economics professor at Johns Hopkins University states that the single most important obligation of the FED is to track the United States money supply. Amazingly though, the FED has no interest in knowing how many dollars are circulating or how currency is being used. They dropped M3 data years ago and are now not reporting M4 data.
CONCLUDING NOTE:
My prior-published papers recommending inflation investments through Treasury TIPS and associated mutual funds/ETFs continue to pay great dividends. With Milton Friedman’s license plate guidance, three internet “go-to” data sites, and an on-line calculator at your disposal, you can now forecast inflation on a month-to-month basis to plan your inflation investment strategy. As a bonus recommendation, sign up Prof. Hanke’s gold sentiment index and his soon to come sentiment inflation index at www.goldsentimentreport.com. Both are leading indicators reported daily and sent to your email box.
For your financial health and well-being, Dan Steele