QUESTION:
POST MAY 2021, WILL GOVERNMENTS ALLOW INFLATION TO DEVALUE CURRENCIES TO MITIGATE MASSIVE OUTSTANDING SOVEREIGN DEBT OR DEFLATION BY HOLDING TREASURY (CENTRAL BANKS) RATES TO SUB -0- AND FORCING FORFEITURES?
IN PLAIN LANGUAGE:
POST MAY 2021 WILL CITIZENS BE FORCED TO SUFFER SHARPLY INCREASING COSTS OF GOODS AND SERVICES WITHOUT EQUIVALENT CORRESPONDING ECONOMIC GROWTH (SOMETIMES IDENTIFIED AS “STAGFLATION”) OR, IN THE ALTERNATIVE, WILL CITIZENS BE FORCED TO SUFFER STAGNANT, SUB -0- RETURNS ON TREASURIES, FALLING HOME/COMMODITY VALUES, AND MASSIVE BANKRUPTCIES SO THAT GOVERNMENT DEBT DEFLATES AS YOUR DOLLAR CHEAPENS? IT’S ALL ABOUT GOVERNMENT-GENERATED DEBT FAR BEYOND CITIZENS’ ABILITY TO PRODUCE PRODUCTIVE GOODS AND SERVICES (THE GROSS DOMESTIC PRODUCT “GDP”). U.S. GOVERNMENT GENERATED DEBT NOW EXCEEDS THE GDP BY BILLIONS OF DOLLARS.
DAN’S COMMENTARY:
For the first time since World War II governments have no place to go and now will probably have to inflate sovereign-created debts away. Governments have in fact been using printing presses and electronic pathways to create currency for some time now, vastly reducing monetary value to its citizens. In fact, this has been going on since the 2008 financial crisis despite the Federal Reserve’s (“the Fed”) attempt to reduce quantitative easing (“QE”) in 2013. That’s when the Fed Chairman Ben Bernanke implied in congressional testimony that because the economic outlook was improving, the Fed would begin to slow its pace of bond purchases that it began in response to the 2007-2009 financial crisis. Bond yields spiked immediately, climbing from 2.03% on May 22, 2013 to a peak of 3.04% on Dec. 31, 2013. Treasury selloffs bled into corporate bond markets causing the yield on the S&P U.S. High Yield Corporate Bond Index to surge from 4.56% to 6.53% in just over a month. This “temper tantrum” forced the Fed to largely continue QE.
Thus, for 13 years now we have been in a vicious cycle of more and more sovereign debt financing that has resulted in high volitivity in equity markets which has caused substandard performance returns of stock market indexes. At a point, the history of similar activities in other countries demonstrates that such fiscal mismanagement can cause sovereign instruments to collapse in weeks or months, putting them in default where the sovereign is no longer able pay returns on bond debts and other obligations. China and other countries, after investing in U.S treasuries as the “go to” safest world-wide investments, are now selling, not buying, U.S. Treasuries.
To mitigate this dilemma and save the sovereign from collapse, governments have in most instances INFLATED the economy causing citizens to pay increased prices for goods and services. Rarely, but it has happened, governments attempting to solve destructive sovereign debt consequences have DEFLATED the economy primarily by capping bond returns rather than increasing bond holder returns consistent with increasing costs of goods and services. But we have been there before: The severe recession following World War II caused the United States to elect the DEFLATION remedy and bonds returned negative (minus) 5 to 10 percent yields to allow the United States to pay off devastating deficits precipitated by the war with less expensive (cheap) money. Before the U.S. government was able to initiate a deflationary policy in the post-WW II economy, citizens suffered 9% inflation each year, 1941 and 1942, and a shocking 18% in 1946. Then, as a consequence of the government’s subsequent deflation policy, cash lost 7.5% of its value in the late 40s-early 50s.
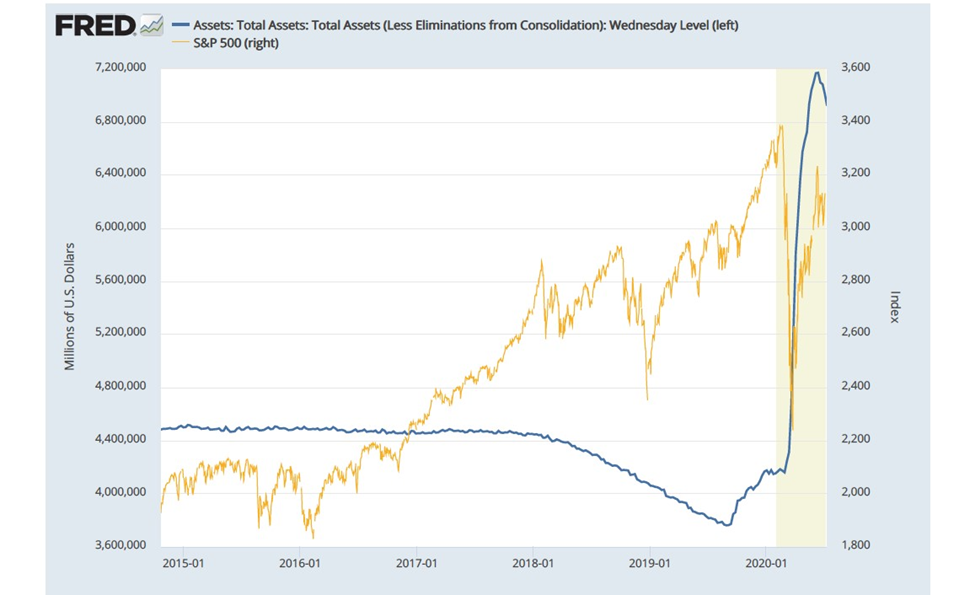
Should the U.S. government elect to DEFLATE its way out of current deficits this time, look no further than the last three years when the Federal Reserve, from January 1, 2018 (as indicated by the blue line on the FRED chart below), again began to reduce QE, meaning that it reduced the pace and purchases of Treasury bonds and mortgage-backed securities, thus reducing the amount of money it was feeding into the economy. Notice S&P 500 performance post January 2018 (the yellow line). As Fed liquidity reduces (blue line), equity market volatility increases. Two related down turns then occurred in September-October 2018 resulting in a 17.55% loss and a loss of 30.54% in February-March 2020 on the S&P 500.
The corresponding graph, below, quantifies Fed purchase reductions from March 13 through May 29, 2020:
\
\
\
\
\
\
\
\
\
\
\
\
\
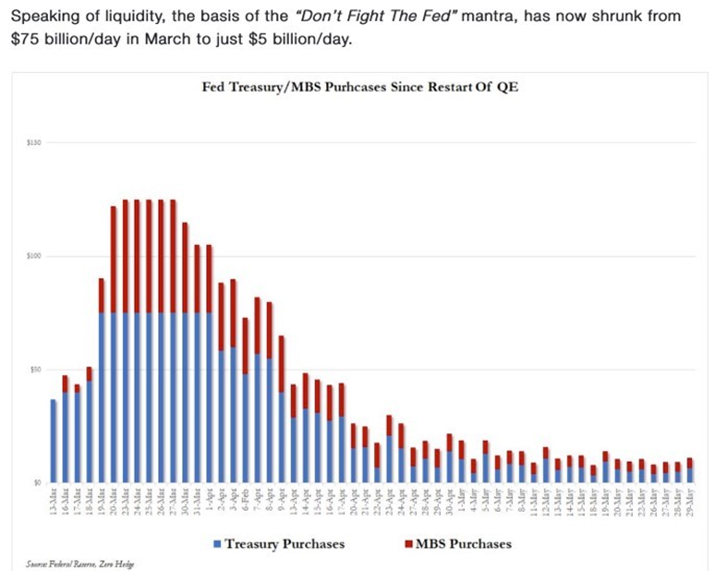
This graph’s three-month period alone depicts the Fed’s greatly reduced spending from $75 billion to just $5 billion. This caused the S&P 500 to lose 11.13% in that three-month period. Had COVID-19 not forced the Fed to abruptly reverse its reductions policy, that would have become an annualized year 2020 S&P 500 loss of 33.64%. The U.S. government’s inability over 13 years to have responsibly managed fiscal policies, including the Fed’s almost -0- interest rate program, has caused such adverse consequences which leaves you with less return on your money today and likely inflation or deflation tomorrow. Equally significant, with almost -0- interest rates, inflation/deflation are about all the Fed has left to influence economic policy going forward.
Cash lost 7.5% of its post-WW II value in the early1950s as a consequence of deflation. This time your cash value losses will be far worse because cash had a greater intrinsic value then than it does now: Back then, short term interest rates were paying a return of almost 4 percent (0.375%). They are now paying you fractions of a percent, very close to -0-. Thus, your cash this time will be devalued far beyond that of the post-WW II 6.3%-7.5% range because the Federal Reserve has already used up its interest rate leverage by devaluing interest rates of those returns – then 4% for the safest investments. I.e., now your money is worth less before it deflates because of almost -0- interest rates. The 7.5% post-WW II deflationary loss could easily be a negative 14 to 15 percent loss of value to you.
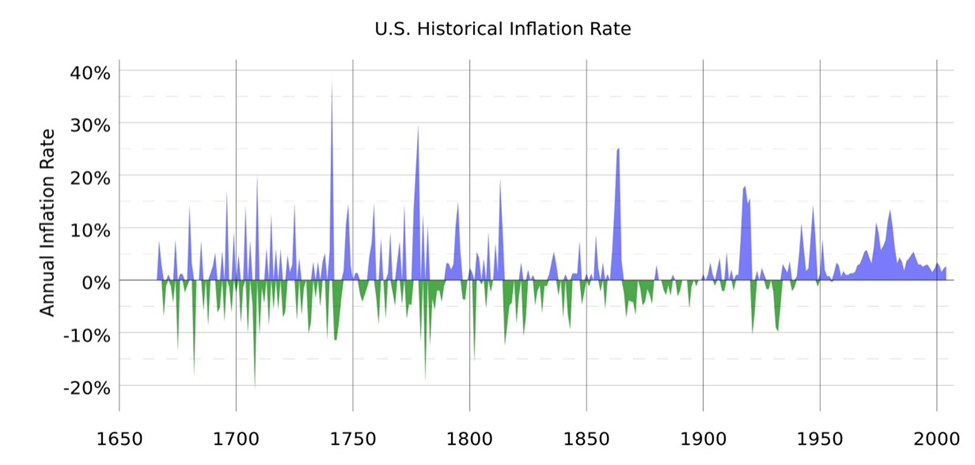
Like currency, your time is a valuable resource. For this reason, I have mostly focused on the devastating consequences of DEFLATION as a government policy going forward because I believe INFLATION consequences are much better understood. Our last bout with the latter was about 40 years ago, whereas post-WW II deflation was now 70 years ago. Historically, however as this chart (below) demonstrates, DEFLATION (depicted in green) has very much been a part of United States’ economic history:
\
\
\
Suffice to say, INFLATION can be as devastating as deflation by greatly raising the costs of a home, goods, and services expenses beyond what you can afford. The rate of consumer price inflation reached 12.2% for the 12-month period ending in November 1974, and 14.6% for the 12-month period ending in May 1980. Thirty-year mortgage interest rates reached 18%. From a macro perspective, much like today, there was rising inequality, soaring budget deficits, ballooning trade deficits, and falling savings rates.
My next paper in this space will discuss how to invest in inflationary and deflationary environments. Each requires very different investment approaches.
Thoughtfully yours for your financial health, Dan Steele