QUESTION:
I HAVE BEEN A BIG ADVOCATE IN THE LAST SIX MONTHS OF BUYING AT WWW.TREASURYDIRECT.GOV “BILLS” WITH TERMS OF 13 AND 26 WEEKS TO MATURITY PAYING ALMOST 5 PERCENT YIELD/RETURN. AT MATURITY THE TREASURY AUTOMATICALLY SENDS YOUR PRINCIPAL AND EARNED YIELD TO YOUR BANK ACCOUNT. BUT LATER IN 2023, WILL THE TIME COME TO INVEST IN 10-YEAR AND 30-YEAR “LONG BONDS” AT TREASURY DIRECT? WILL THAT/THOSE PURCHASE(S) BECOME A PROFITABLE INTERGENERATIONAL BOND-BUYING OPPORTUNITY – THE THIRD ONE IN THE LAST 43 YEARS?
DAN’S COMMENTARY:
What is “maturity” and how long do you have to hold the bond?
As a primer, know that you do not need to hold a bond to 10 or 30-year maturities because they openly trade in the secondary bond market where you can easily sell them. And, as I state throughout this commentary, if you follow my methodology, not long after your purchase, people will want to buy your bonds and will pay you a premium to do so. A bond that’s trading at a premium means that its price is trading higher than the face or par value of the bond. Following my methodology, you’ll be buying bond(s) paying higher rates than they have in many years. Then, as rates come off those highs, as they always do, bond price premiums conversely rise, again because everyone wants your bond and not a new issue paying less.
On the other hand, perhaps, you want to hold the bonds to maturity because, over 10 or 30 years, you’ll receive higher rates payable, when the bond matures, than later prevailing bonds are paying. Over the last 41 years, for example, interest rates have been in a long decline going to almost zero before the recent rise. Also, know that during your holding period, your bond will pay a current annual yield of not less than 1.25 percent, the coupon payment, determined at your purchase based on demand, payable semiannually. So, for example, a face value of $1,000 (par) with a coupon rate of 5 percent will pay you $50.00 a year ($25.00 semi-annually). Then again, if you don’t need your bond investment and you’re 40 years-old, what’s a matter with holding the bond for 30 years, meaning that when you are 70 years-old and your bond matures – you’ll then receive your principal amount with a 14 percent return to retire on. A fourteen percent return looks awfully good in a world of very low interest rates as we have seen in the last forty-one years before the recent rise!
How do you come up with a 14 percent return on my bond?
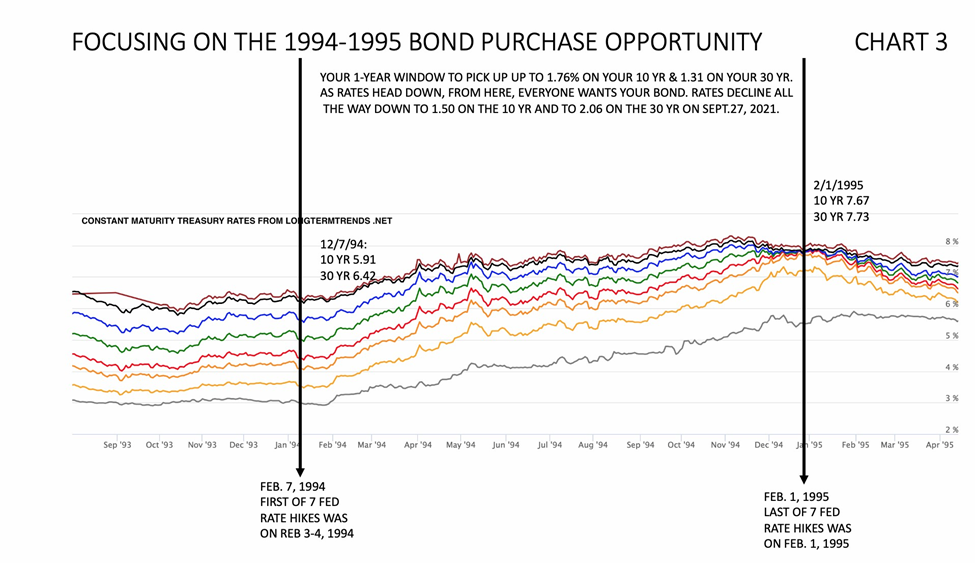
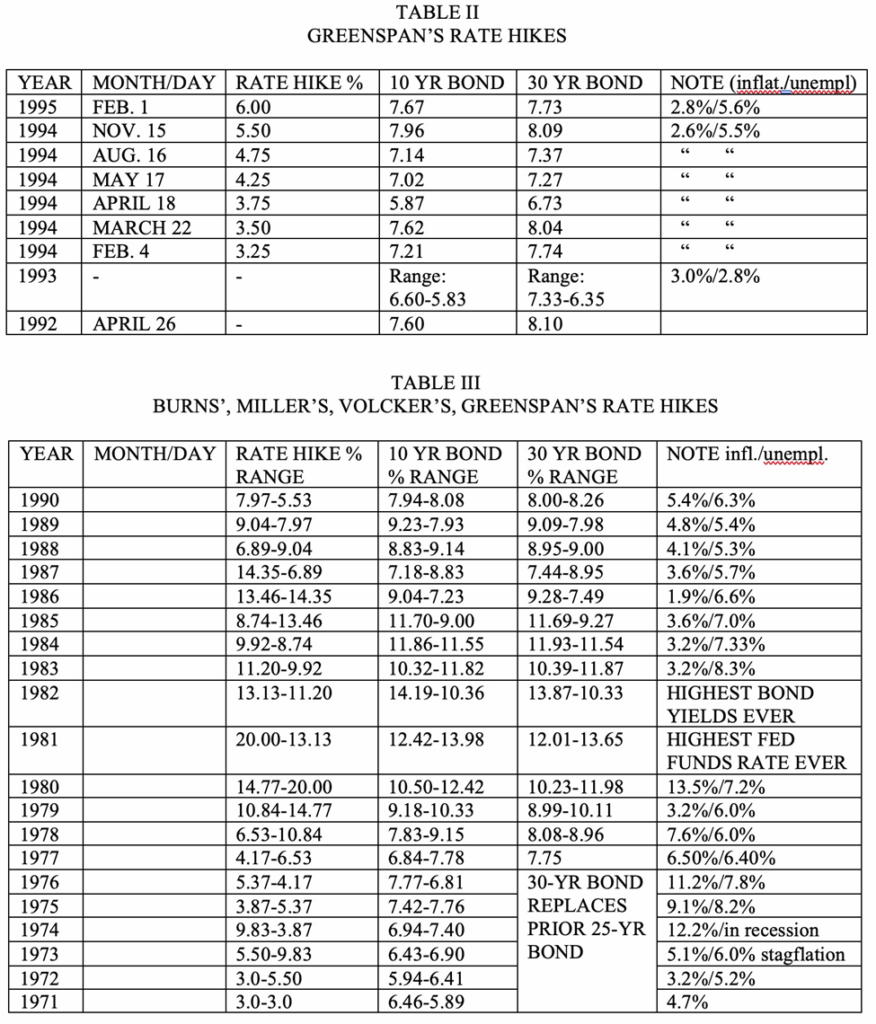
I’m glad you asked. Because in 1985 you actually could have bought a 10-year bond with a 7.67 percent return and a 30-year bond with a return of 7.73 percent. See CHART 3; or in 1980, a 10-year bond with a 14.95 return and a 30-year bond with a return of 14.14 percent. See CHART 1. Your 30-year bond would have matured in 2010; your $100,000 investment would have paid you a risk-free return of $14,000, exempt of state taxes, when prevailing interest rates were paying 0.15% (federal funds effective rate).
By the way, you can also buy a 20-year bond as well. For research purposes my tables and charts, below, did not include the 20-year bond because it’s use was canceled in 1986 and reintroduced on May 20, 2020. Its rate will fall between the shorter-term 10-year bond and longer-term 30-year bond.
How will I know the optimum time to buy a 10 or 30-year bond in 2023?
Best way I know is to look back in economic history. That’s what my Tables pages and corresponding Charts pages are all about. Study them closely! They depict two of the best bond-buying opportunities in the last 43 years, if not over the last century! The Burns, Miller, Volcker, Greenspan era was a blockbuster as Volcker raised the federal funds rate to 20 percent between 1979-1981 to defeat historic stagflation resulting from Jimmy Carter’s four presidential years, an oil embargo, and a prior 1970s inflation bout.
The Greenspan 1993-1995 era less so, but it was still a significant bond-buying opportunity. CHART 3 depicts the period of seven Greenspan rate hikes from Feb. 7,1994 to Feb. 1, 1995, almost exactly a oneyear period. Rates culminated at 7.67 percent for the 10-year bond and 7.73 percent for the 30-year bond. From there, rates precipitously declined steadily over the next 28-years to almost zero. Imagine holding a 30-year bond during the subsequent sub-marginal rates period while your bond is paying 7.73%, maturing in 2025. You would look brilliant! See CHART 1. Notice the long, deep rates decline going to -0-% (CHART, bottom right).
But again, how would I have known to buy before or after February 1, 1995 or August 31, 1981? Study CHART 3. Notice that rates started flattening in Dec. 1994. This was you “heads up” – a twomonth alert that rates were leveling off, portending the end of the Greenspan rate hike era. Compare this against the “window” afforded you during the Burns-Volcker era, CHART 2. As in the Greenspan era, you had exactly a 1-year opportunity to get in on his rate hike period, from March 18, 1980 to March 18, 1981, but that market gave you an additional six months, until September 21, 1981 to make your purchase of 15.76 percent for the 10-year bond and 15.20 percent for the 30-year bond before rates leveled off and declined.
These all are meaningful and significant guidelines for you now, in the Powell rate hike era.
Also, notice the high correlation in time between the last rate hikes and the first/initial decline in bond rates: The last Greenspan rate hike of six percent was on February 1, 1995; The rates’ high-point of 7.96 percent for the 10-year and 8.09 percent for the 30-year occurred forty-six calendar days in advance, on November 15, 1994. The last Volcker rate hike of twenty-two percent was on December 1, 1980; The bond rates’ high-point of 15.45 percent for the 10-year and 14.77 percent for the 30-year bond occurred exactly nine months afterward, on August 31, 1981.
That’s the historical 43-year take-away: If the preponderance of evidence is pointing to the last rate hike, start looking at a two-month window to make your optimum purchase before that time; If the preponderance of evidence is uncertain you may have up to 12 to 18 months to do so after the last rate hike. It’s not an exact science and nothing is for certain. Keep a macro-view by focusing on how bond rates are trending: up, down, or leveling off as we see in CHARTS 2 AND 3. You’ll then capture over 10 or 30 years significant bond values and premiums.
When may that optimum time occur in the Powell era to buy a bond?
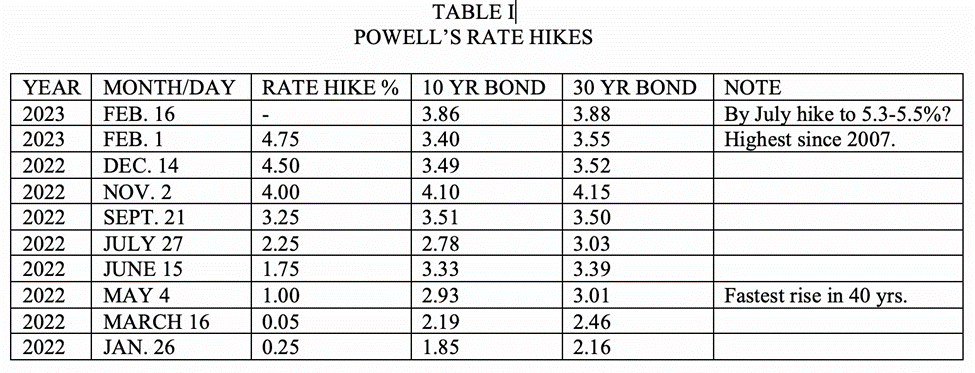
FED Chair Powell said rates could go to 5.3-5.5 percent (the “terminal rate”) by July 2023 and that he wants to bring inflation down to where it was – 2 percent. The federal funds rates are now in the 4.5-4.75 percent range. But the FED has consistently been sending contradictory messaging to us.
This what caught my attention on February 22, 2023: James Bullard, St. Louis FED President said “if inflation doesn’t start to come down, you risk this replay of the 1970s where you had 15 years where you’re trying to battle the inflation drag . . . That’s why I’ve said let’s be sharp now, let’s get inflation under control in 2023 and it’s a good time to fight inflation because the labor market is still strong.”
Also know that the year-over-year Personal Expenditures Price Index (PCE), the FED’s preferred inflation index, just came in (Feb. 24, 2023 print) reporting that the cost of U.S. goods and services increased 0.6 percent in January 2023, the biggest increase since last summer. It accounts for how consumers change their buying habits (buying cheaper goods) due to rising prices. It is business-reporting data, not consumer CPI data. The PCE has been more than 1.15 percent above the 30-year Treasury rate. That has only happened two other times in recent history, briefly in the fall of 1979 and the summer of 1980, and then the PCE year-over-year was just 0.3 percent above the 30-year rate. The inflation rate hasn’t exceeded the 30-year Treasury in modern history.
However, now “long-term rates have been slow to rise because the market has believed that inflation would be fast to come down. But the longer inflation stays high, and the slower it takes to fall, the more likely it becomes that long-term rates will rise above the inflation rate. On average, the 30-year rate has traded 3.12% above the PCE inflation rate, implying an 8.12 percent 30-year rate, assuming PCE comes in at 5% [the week Feb. 20, 2023]. So, either inflation needs to start falling fast, or long-term rates will have to head much higher soon.” From Mort Capital Management analysis at Seeking Alpha. As I write this commentary (Feb. 24, 2023) PCE inflation just came in at six percent! Wow – 8.12 percent is more than double the current 30-year bond rate now of 3.93 percent. 8.12 percent is how high long-term bond rates could go this time!
So, be patient, watch the direction of the federal funds rate, looking for the “terminal” rate, and don’t jump the gun on your purchase!
At what point would I miss this long bond-buying opportunity?
That’s a subject for a later article as it gets us into the finest details of economic macro analysis. However, this is what you should know:
Treasury bonds become a “store of safety” when market psychology switches from “risk-on” to “riskoff.” You’ll know about that switch by bringing up a “fear indicator.” From Real Investment Advice this is Bert Lance’s current Market Fear/Greed Index:
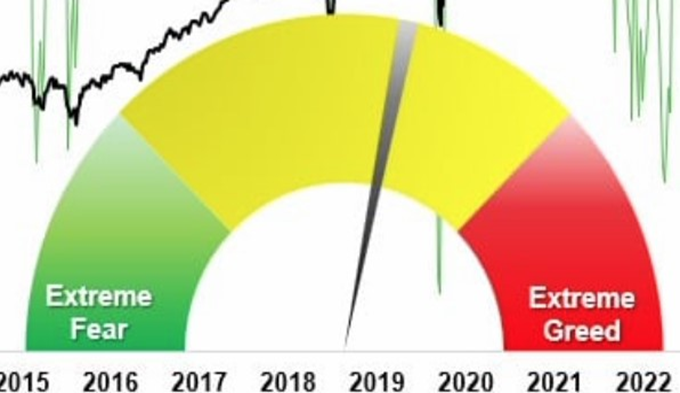
It clearly registers “risk-on” meaning markets keep on buying equities. This is confirmed by the S&P 500 (SPX) which, after this last week’s serious decline, is still within 17.61 percent of the all-time-high. It’s not a bear market until the decline is 20 percent. Further, the lagging indicators — employment and wages are still growing, albeit slowly.
But you say, wait a second, your charts and your discussion are all about looking for a yield curve inversion. True, but now we are addressing at what point would you miss this long bond-buying opportunity which is about “markets” and knowing of/expecting an immediate approaching recession which the inverted yield curves predicted. Why would I not buy at inversion ahead of recession?
Here’s the point: It is when curves un-invert from inversion that you know a recession is immanent. At that exact time expect shorter-term Treasury bills (the 4 and 8 week, 3, 6 and 9 month bills) yields to correct lower and the longer-term Treasury bonds (the 1, 5, 10, 20, and 30 year bonds) to correct higher. I.e., the yield curve is correcting with shorter term vehicles paying less yield and the longer-term vehicles paying more yield. At that point, you want to be in on the higher-paying yields of long bonds.
However, as long bond yields generally start going higher and market interest rates (mortgages, credit card interest, etc.) and shorter-term bond rates generally start going lower may also be the same time that the economy and markets are correcting: everyone can now feel, touch, and taste recession – as it becomes real and recognized and growth, employment, wages, etc. may be contracting and inflation itself, the very reason for rate hikes, starts to come down as liquidity (money supply) and demand diminish.
Isn’t that my optimum time to buy long-term bonds – before recession?
Not necessarily – if the FED continues to hike into the recession.
You would think that the FED would want to reach the terminal (final) rate before recession. After all, why would your government want to worsen all the suffering that comes with a recession, especially when recession is the cure for all the factors that brought it on? I.e., why would the FED continue with its rate hikes when the recession itself is remedying an overheated economy, inflation, too much money/liquidity chasing too few goods, etc.?
Bert Lance at www.realinvestmentadvice.com excellently answers this question and sums all this up, stating as follows:
“Regarding yield curve inversions, the media always assumes this time is different because a recession didn’t occur immediately upon the inversion [i.e., no coming inflation]. There are two problems with this way of thinking.
FIRST, The National Bureau Of Economic Research (NBER) is the official recession dating arbiter. They wait for data revisions by the Bureau of Economic Analysis (BEA) before announcing a recession’s official start. Therefore, the NBER is always 6-12 months late, dating the recession.
SECOND, it is not the inversion of the yield curve that denotes the recession. The inversion is the “warning sign,” whereas the un-inversion marks the start of the recession, which the NBER will recognize later.
That last sentence is the most important. Regarding a “recession countdown,” the initial inversion is not the signal. It is when the curves un-invert that a recession is approaching. The reason is that the Federal Reserve is rapidly cutting rates as the recession is recognized. Such causes the short end of the yield curve to fall faster than the long end.”
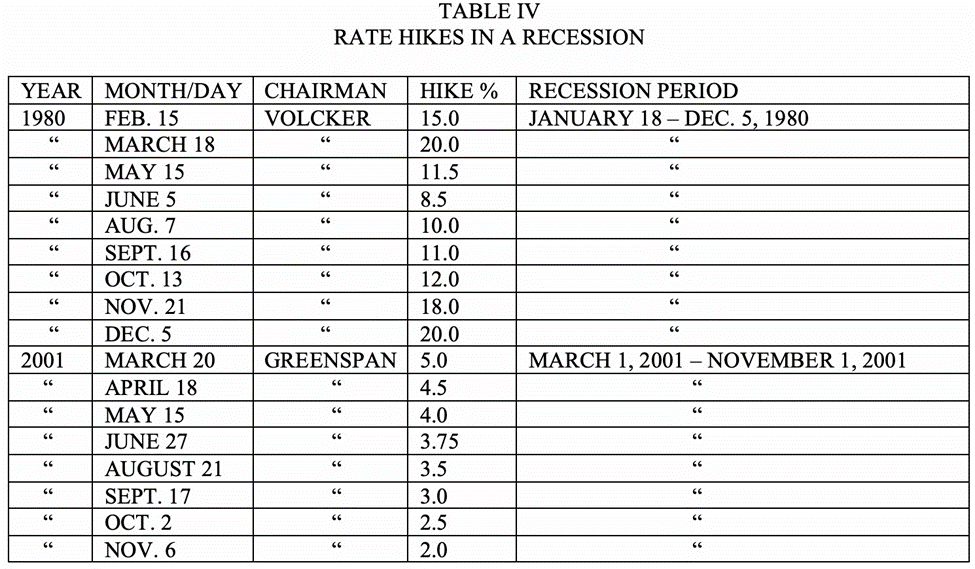
The crucial point is this: Once the recession is recognized as a recession with all the symptoms discussed above, do not necessarily expect to see the FED’s last hike – the terminal rate. The facts are that both Volcker and Greenspan hiked rates into recessions. See Table IV, attached, for details. In all fairness to the FED, although recessions bring on tangible suffering that can be “felt, touched, and tasted,” recessions do not become officially “recognized” as a matter of record until later, sometimes after they have ended. So, do not jump the gun by buying long-bonds at un-inversion or when you are feeling, touching, tasting recession. Look to see if the FED is still hiking rates into the recession and then anticipate the “terminal” rate or close to it as I explain earlier in this commentary.
After “uninversion” expect the recession within six to nine months after that or earlier. CHART 3 beautifully shows all the yield curves. The first one to always uninvert is the 10-year/less 3month, meaning that the 10-year bond starts paying more yield and the 3-month bill less. I.e., the curve starts uninverting and you get paid more for holding the longer-term vehicle because of the “time value of money,” a subject for another time. This is what it looks like on a chart:
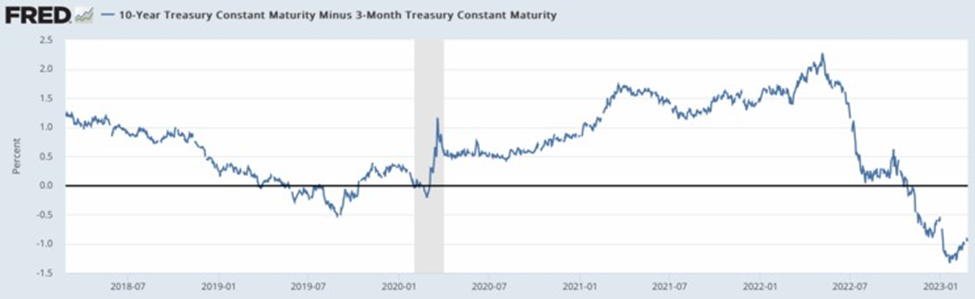
On the right side, on January 20, 2023 the chart registered an inversion of 1.24; on January 24, 2023 it reduced to 0.91. The 10-year vis-a-vis the 3-year have started to uninvert. You too can easily follow this leading indicator at the St. Louis Federal Reserve Bank website, www.fred.gov
How do I approximate my premium above par to sell my bond before the 10 or 30-year maturity? Go to www.dqydj.com and bring up it’s yield to price calculator. With straight-forward inputs, it will estimate the market value of your bond when you want to sell. For a more hands-on tool is to download from the Apple Store, et al., the free BA II Plus Financial Calculator from Texas Instrument to your device. There’s a small learning curve, but it gives you the option of knowing your bond’s market value at any time with four keystrokes. Your brokerage firm (Vanguard, Fidelity, etc.), who will sell your bond, will provide precise values at the time.
Here’s to your financial health, well-being, and prosperity, Dan Steele
CHARTS AND TABLES FOLLOW BELOW.
THE REFERENCED CHARTS:
CHART 1:
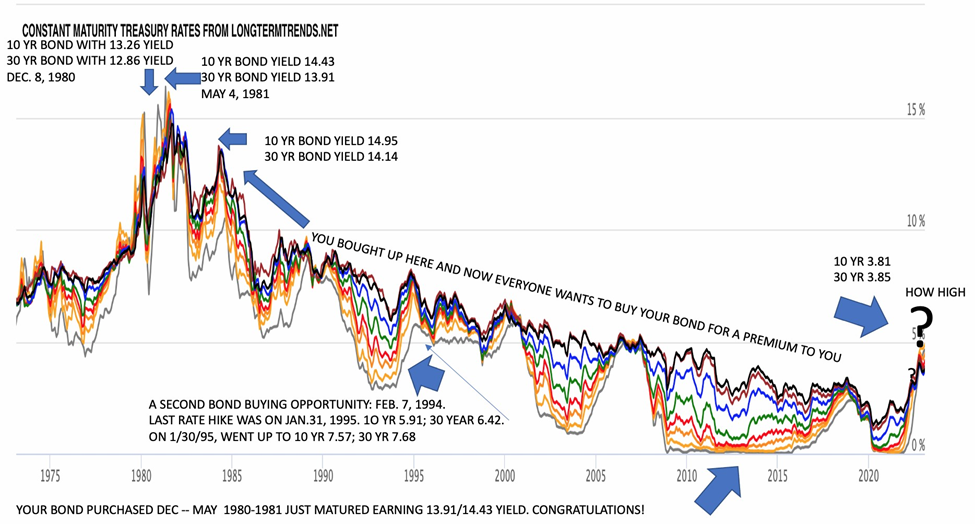
CHART 2:
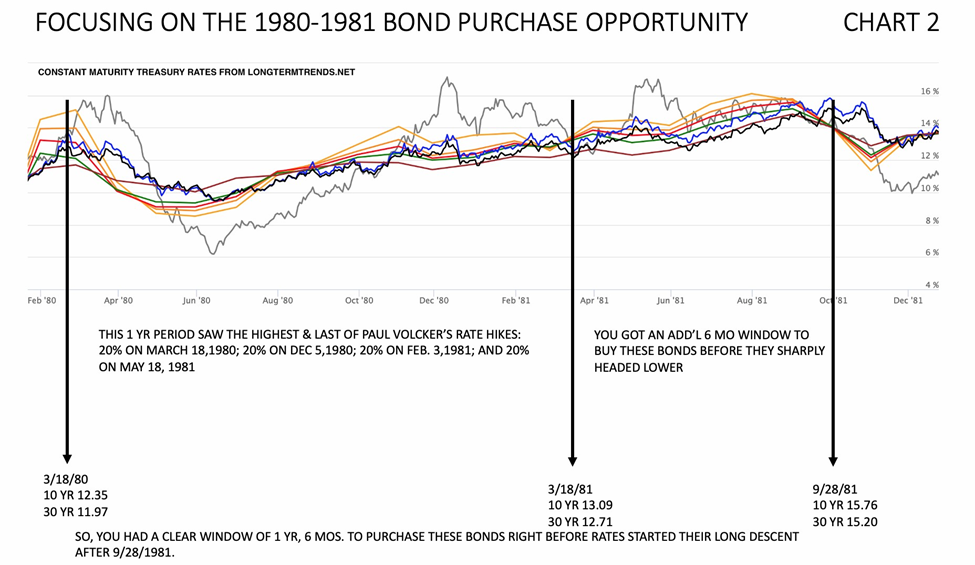
CHART 3:
TABLES PAGE:
/
/
/
/
/
/
/
/
/
DISCLAIMER
The information provided herein is ONLY for discussion purposes. I provide no warranty as to the accuracy and timeliness of the information/data provided and I make these tools freely available exclusively for purposes of initiating discussion. I reserve the right to modify and/or update my rationale and tools without any notice. I am not licensed by FINRA or any other licensing authority to sell financial products or to give professional financial advice. Your reliance on any information provided herein shall not be interpreted or regarded as personalized investment advice. My information/data is only a part of many factors to consider when investing money. When you do so you are on your own.