SUBJECTS:
IS THE S&P 500 COMPOSITE, PRICE TO EARNINGS, OF 24.79 PERCENT SO TOXIC THAT IT IS LIKELY TO LOSE 70 PERCENT OF IT’S VALUE?
DOES A DANGEROUS AND FISCALLY INFLATING WORLD SATURATED IN SOVEREIGN AND INCREASING INDIVIDUAL DEBT DEMAND A FLIGHT TO BONDS AND OTHER SAFE HAVENS?
IS INVESTING IN TODAY’S STOCK MARKET A FOOL’S ERRAND?
COMMENTARY (READ DISCLAIMER AT END):
Current, very real risks of investing in the stock market are starkly presented in a recent YouTube by Dr. Dave B. Collum, an organic chemistry Professor at Cornell University’s Chemistry Department. In his spare time, he also has a achieved an esteemed reputation as a leading, straight-forward, honest thinker in a world where financial/equity markets clash with politics. Please view/listen to his YouTube presentation at https://youtu.be/EP1GnWJHbCA?si=y8rEotMjChDb3Mm0. This paper only covers the above subjects which he brilliantly discusses in his YouTube beginning at the 12:30 time marker. My task here simply is to document that part of his YouTube presentation and to supplement by putting “some meat on the bones.” Here goes:
The last time markets were said to be “fairly valued” was after the 2008-2009 “great recession.” At that point, S&P 500 “fair value” was around a price/earnings ratio of about 15 percent. The same markets are now very extended from that “fair value” estimate. The price/earnings ratio of the S&P 500 is now overvalued by between 25 and 31 times versus actual earnings depending on when you measure.
Regardless how and when you measure “fair value,” however, one overriding metric on Wall Street will mean lower valuations going forward. That “one metric on Wall Street” that will not be broken under any circumstances is this: The S&P 500 has corrected over the last 100 years (from 12/31/1925 to 12/31/2025) for M2 money supply. As a whole, today’s markets are fairly priced at about only 40% of what they print! What then is M2?
M2 is the U.S. Federal Reserve’s estimate of the total money supply, including all the cash people have on hand, plus all the money deposited in checking accounts, savings accounts, and other short-term saving vehicles such as certificates of deposit (CDs). Retirement account balances and time deposits above $100,000 are omitted from M2. www.investopedia.com. Between March 2020 and July 2021, before it subsequently hit a high of 9.7 percent in this latest inflation bout, M2 had grown at an average annualized rate of 23.9% — the fastest since World War II. Wall Street Journal (July 20, 2021). What does this exactly mean?
Because M2 accounts for the total money supply, including all inflation, the 100-year Chart, below, demonstrates that 12/31/1925 dividends paid 6.6% with 1925 inflation of 2.35 percent, thus in 1925, dividends paid an effective rate of 4.1 percent; “Current” inflation has reduced the value of the dividend to about 1.5 percent over the last 40 years after inflation. The difference – 3.6 percent is the number recorded on the Y axis of the Chart where the gold line indicator (M2 money supply) and green line indicator (S&P 500 composite), also adjusted for inflation, merge. Thus, this chart represents the “effective” S&P 500 return over the same period. Note also the top dashed line indicating that markets have drifted down slightly, adjusted for inflation, over the last 100 years.
S&P 500 COMPOSITE CORRECTED OVER LAST 100 YEARS FOR M2 MONEY SUPPLY
Courtesy of Dr. Dave Collum
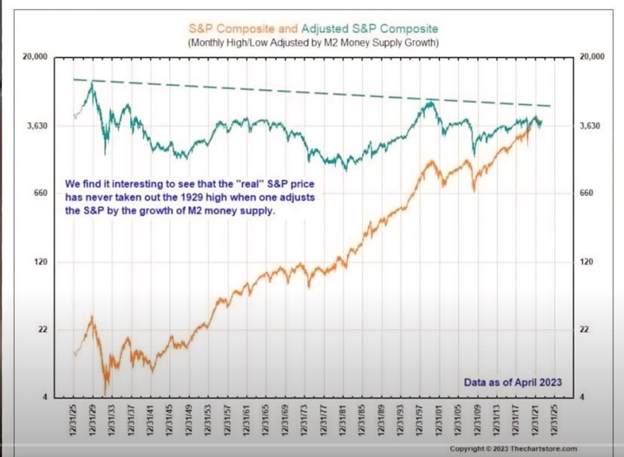
Stunningly, what this means: if inflation and the S&P 500 perform just as they have in the last 100 years, the U.S. stock market will return the historical dividend rate of about 3.79 percent into the future. I.e., stocks and bonds will have near identical returns of 3.79 percent after taxes, regardless of the risk premium and trading cost differences. The years of seven, eight, nine percent average annual returns will be gone.
Market wise, Dr. Collum anticipates a likely market decline of up to seventy percent from here. The S&P 500 declined about 50 percent in the “great recession” of 2008-2009.
Regression of price earnings to the historical 53-year average of 19.4 from today’s 24.79 ratio that would truly return the market to “fair value” means turning the calendar back just seven years to 2017. The S&P 500 2017 average closing price was 2,449 and it’s price earnings ratio average over the prior 46 years, from 1971 to 2017 was, in fact, 19.4 percent.
Most important and easily missed, Dr. Collum states such a correction to “fair value” means that the market must live around that “fair value” ratio – no V shape recovery, no Federal Reserve quantitative easing recovery. I.e., expect an ongoing return like the 1971-2017 price earnings ratio of 19.4! From there, Dr. Collum suggests reasonably anticipated returns to be between three percent and negative three percent over the next 40-years as repercussions of on-going inflation and sovereign national deficits play out.
On a macro level, when you think about it, over the long-run, how can a nation’s wealth ever be more than what it produces – it’s gross national product? But more than that, it must be real GDP – products/ services that truly add value to the citizenry. Dr. Collum, for example, points out production that does not contribute to the wealth of the nation: Construction of battle ships, fighter jets, and explosives are examples. But more than that, he submits that the value of goods and services must be accurately measured to determine if their use/production adds enough value to the GDP equation to include them worthwhile. “Rapidly depreciating” items/services should be excluded from the GDP equation.
As an example, he proffers that geriatric products, innovations, services, and medical care for boomers should not be included in the GDP equation precisely because their use is for a “rapidly depreciating asset” – senior citizens with short life spans. For that matter, he points out that battle ships, fighter jets, and explosives, when employed, are also rapidly depreciating assets built to have unspecified, unpredictable life spans that do not contribute much to the wealth of the nation. Dr. Collum submits that companies/organizations of such products should publish depreciation schedules to know how to include their values in the GDP, if at all.
As great analysts often do, Dr. Collum, invokes insights from another brilliant analyst, Warren Buffett, through an article Buffett penned on November 22, 1999, published in Fortune, which I attach and encourage you to read.
There, Buffett writes “ . . .we can’t come even remotely close to [annual market returns/expectations back then] of 12.9 percent . . . over the next 10, 17 or 20 years [unless] one or more of three things happen:” (1) Interest rates, then approaching above 6 percent, must fall further; (2) Corporate profitability in relation to GDP must rise: 5% growth in GDP . . . “is a limiting factor;” and (3) it’s not by assessing how an industry will affect society or how much it will grow, but rather determining the competitive advantage of any given company and, above all, the durability of that advantage. Buffett asks “[d]o the products or services have wide, sustainable moats around them?”
How did Buffett do going forward? Condition (3) is subjective. The other criteria can be measured objectively on Buffett’s timelines, as follows:
| Markets over: | 10 years 2000-2009: | 17 years 2000-2016: | 20 years 2000-2019: |
| S&P 500 annualized return:* | 1.22 | 6.16 | 7.69 |
| Dow Jones annualized return:* | 0.56 | 1.73 | 5.82 |
| Interest Rates were between: | 6.52-0.15 | 6.52-1.30 | 6.52-0.5/0.10 |
| GDP: | 4.08-neg.2.60 | 4.08-2.71/2.24 | 4.08-neg.2.77 |
*20-year averages: S&P 500: 5.03%; DJI: 4.65%, not 12.9% — Buffett was right!
Buffett wins: interest rates drastically reduced in all three periods;
Buffett loses: GDP/corporate profitability never trumped five percent growth;
Notwithstanding winning interest rates, (one out of two conditions) we never achieved anything close to 12.9 percent annual returns in any of the 10, 17, or 20-year periods, above.
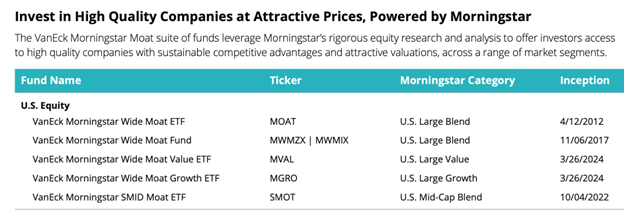
Regarding Buffett’s third “wide-moat” condition, a variety of “wide-moat” funds and ETFs are readily available for investment possibilities here:
Thoughtfully, for your investment health and well-being, Dan Steele
MY COMPLETE DISCLAIMER ABOUT FOREGOING CONTENT:
The information provided herein is ONLY for discussion purposes. I do not vouch for or warranty the information/data provided as to truth, accuracy, correctness, appropriateness, or timeliness. I make this content freely and publicly available exclusively for purposes of initiating discussion. All and any information/data may be misleading and wrong requiring your additional research and due diligence. I reserve the right to later disclaim, modify and/or update my rationale and tools without any notice to anyone. I am not licensed by FINRA or any other licensing authority to sell financial products or to give professional financial advice. Your reliance on any and all information provided herein shall not and cannot be interpreted or regarded as advice of any kind. My information/data, right or wrong, is only a part of many factors you must consider when investing assets. When you act to do so, you are on your own.