AN ECONOMIC RECOVERY OR 1970’S-STYLE DECLINE FOR THE YEAR REMAINING, 2022?
My highly esteemed/respected Bryan Rich writes in the attached article, below, that the decline in equity and bond markets has done the Fed’s fiscal tightening job for them and that June 2022’s slightly declining inflation have reduced the risk of a 1980’s style inflation fight; that the second half of the year should be about recovery.
I have a different and opposing view articulated by Dr. Richard Salsman in his article attached below. Contrary to Bryan Rich’s forecast, Dr. Salsman proposes continuing rising inflation, in fact “stagflation” because it will be at a time when the economy is “stagnating or contracting.” Second, Dr. Salsman proposes that there will be no place to hide. As the dollar’s value erodes, both stocks and bond yields will continue a steady decline. His economic forecast is based on two compelling data sets, Figure One at page two and Table Two, page 6 of his paper, attached below.
His figure One recites four periods between 2006 and 2020 that documents a falling SPY ETF but a rising 10-year Treasury bond (TLM ETF). However, in a fifth period from, December 6, 2021 through June 16, 2022, an anomaly occurs reflecting both a falling SPY ETF and a falling 10-year Treasury bond (TLM ETF). Dr. Salsman states “[w]hen bonds and stocks decline a lot and simultaneously, it suggests inflation is rising rapidly even as the economy is stagnating or contracting (or will soon do so).”
His Table Two reflects data about U.S. stocks and Treasury bonds performance over a 69-year time period compartmentalizing 30 years when both stocks and bonds recorded gains; 30 years when stocks and bonds recorded mixed results; and 9 years when both stocks and bonds recorded losses. We are now living within the 9-year capsule, lending further support to Dr. Salsman’s stagflation conclusion, a phenomenon “which last appeared in the U.S. in the late 1960s and 1970s before the supply-side cures of ‘Reaganomics.’ “
But don’t miss what I see to be a brilliant gem in his paper that we can utilize on an on-going basis: Note that Table Two reflects an initial yield-curve spread of only 33 basis points (bps) during the nine rare years whereas the other two 30-year periods had 82 and 174 bp spreads respectively. Moreover, year-after spreads only rose 51 bps for the nine-year period compared to 97 and 153 bps for the other two 30-year periods under study. In Dr. Salsman’s own words, this means as follows:
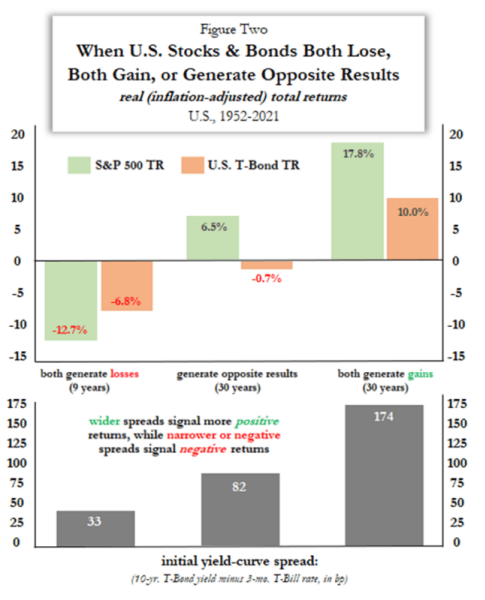
Figure two makes clear that the initial yield curve spread is a good forecaster of the joint performance of stocks and bonds. The yield spread is narrower (averaging only 33 basis points) prior to cases when both assets register losses; in contrast, the spread is wider (averaging 174 basis points) prior to cases when both assets register gains. Historically, the yield curve spread has been narrowest after the Fed has been raising its short term policy rate (to “fight inflation”); and a negative spread (inversion of the yield curve) has preceded all eight recessions since 1968.
I propose that Dr. Salsman’s basis point analysis is the bread and butter of his paper — a tool we can employ on an on-going basis — as he presciently measures basis points in an “initial” yield curve analysis within the three historical scenarios reflected in Table Two.
But first, I must provide necessary definitions of “basis points” and the “yield curve.”
A basis point (often abbreviated as “bp”) is a unit of measurement that denotes a change in the interest rate of a financial instrument and is equal to 1/100th of 1% or 0.01%. It is a usual practice in the financial industry to use basis points to denote the difference (spread) between two interest rates. Basis points prevent ambiguities that could arise when talking about differences in interest rates or other numbers typically expressed as a percentage. Convert percentages to basis points by moving the decimal point two places to the right and add “bp”. 1.25% becomes 125bp.; 1.255% becomes 125.5bp.
A yield curve is a line that plots yields (interest rates) of bonds having equal credit quality but differing maturity dates. The slope of the yield curve gives an idea of future interest rate changes and economic activity. A normal yield curve is one in which longer maturity bonds have a higher yield compared to shorter-term bonds due to the risks associated with time. An inverted yield curve is one in which the shorter-term yields are higher than the longer-term yields, which can be a sign of an upcoming recession. In a flat or humped yield curve, the shorter- and longer-term yields are very close to each other, which is also a predictor of an economic transition.
Going back to Dr. Salsman analysis, he presciently measures the “initial yield-curve” spread in each of his three scenarios, the narrowest being when both equities and Treasury bonds are declining, i.e., the yieldcurve measuring 33 bps. Table Two demonstrates the greater the bp spread portends less likelihood of market declines. Thus, I propose that 33bps becomes a benchmark from which we can determine when to exit markets, i.e., at a time when both equities and bonds are likely in decline — those nine rare years.
For our purposes, we can use Dr. Salsman’s yield-curve analysis as a tool to determine if and what our investment strategy should be. Simply go to www.fred.stlouisfed.org and search “T10y2y” (10 yr Treasury constant maturity minus 2 yr treasury constant maturity). This guidance and Dr. Salsman’s parameters would have had me out of markets on March 3, 2022 when the T10y2y had a spread of 33bps. As of July 1, 2022 the spread was only 4bps.
On a macro level analysis, from which we began, contrary to Bryan Rich’s “recovery” forecast, Dr. Salsman’s work, studying 69 market-years, convinces me that we are entering the gates of a 1970s-styled recession and stagflation. Lock down the hatches! Should he choose to do so, I welcome Dr. Salsman’s comments to my article to us all.
A last word: I was one of the first to forecast serious inflation in my June 30, 2021 paper when I took on one of the biggest “no inflation advocates,” Lacy Hunt. Consumer Price Index inflation then was 5.4 percent but we were told it was “transitory.” I am attaching that paper for your reading pleasure. For your financial health and well-being, Dan Steele
ATTACHMENT #1


Please add bryan@newsletter.billionairesportfolio.com to your safe senders list or address book to ensure delivery.
June 30, 2022
We’ve talked a lot about the Fed’s “tough talk” strategy. They’ve gone from denying inflation less than a year ago (which people believed), to banging the drum about “expeditious rate hikes” (which people believe).
None of which have been accurate.
We have 8%+ inflation and just a 1.6% effective Fed Funds rate.
Still, the Fed has successfully talked the economy down, without having to make meaningful adjustments to interest rates.
By verbally attacking demand, the Fed has flipped the conversation from an inflationary boom, to a recession.
They’ve induced a bear market in stocks, and a related “negative net worth effect.” And they’ve promoted layoffs, by explicitly threatening to loosen the tight job market.
With that the Atlanta Fed is now projecting the second consecutive quarter of negative GDP growth. That’s recession.
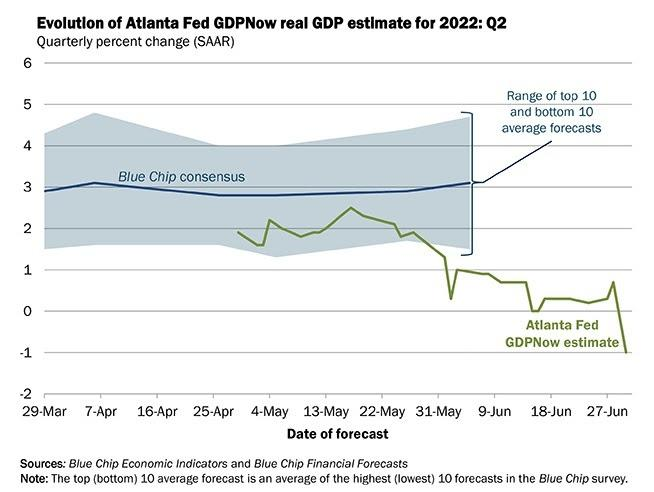
The market has done the Fed’s job for them.
They’ve gotten the desired result of “bringing down demand.”
That said, as we’ve discussed, this reduces the probability of an 80s style inflation fight, and therefore, reduces the probability of a “hard landing” (i.e. crash in the economy). That’s good news.
The recession has been predicted by the bond market (inverted yield curve in March) and has been discounted in stocks over the past six months. The next piece we will need, is evidence of cooling inflation.
On that note, this morning we saw the report on the Fed’s favored inflation gauge (core PCE). It came in softer, and as you can see in the chart below, a declining trend is underway.
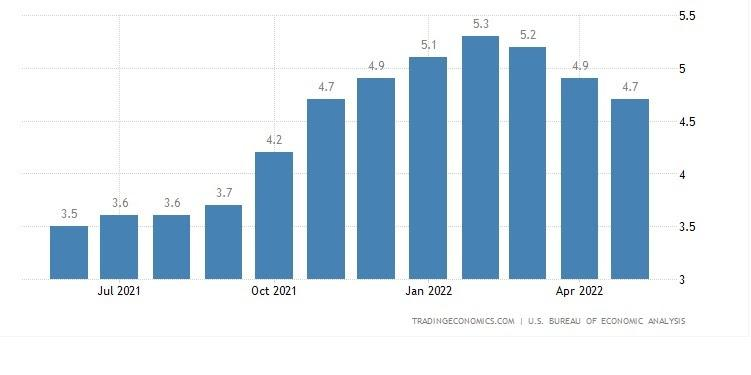
With all of the above in mind, the second half of the year should be about recovery.
ATTACHMENT #2
Stocks and Bonds Hurt Alike Under Stagflation aier.org/article/stocks-and-bonds-hurt-alike-under-stagflation/
Richard M. Salsman
– July 1, 2022 Reading Time: 6 minutes
Returns on U.S. stocks and Treasury bonds have been materially and simultaneously negative so far this year, recording losses of 19.0 percent and 22.5 percent, respectively. This is an anomaly worth examining. Typically, sharp declines in risky equities coincide with solid gains in safe bonds.
A diversified portfolio – part stocks, part bonds – immunizes investors, to some extent, in bad economic times. If stocks plunge, at least bonds boom. But not this time. Why might this be?
Figure One illustrates how different recent investment performance has been compared to four prior episodes between 2007 and 2021. The S&P 500 is down 19.0 percent since last December’s peak, but the return on the benchmark U.S. T-Bond has been even worse (-22.5 percent). Bond prices move inversely with bond yields; the 10-year T-Bond yield has more than doubled over the past half year, from an average of 1.47 percent last December to an average of 3.15 percent so far this month.
/
/
/
/
/
/
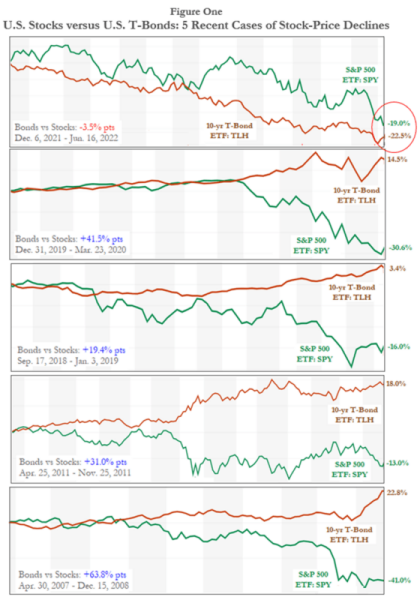
Also notice in Figure One that in the prior four episodes (2019-20, 2018-19, 2011, and 2007-08), while the S&P 500 plunged (by an average of -25.2 percent), T-Bonds gained rapidly (with an average return of +14.7 percent). In these four episodes bonds always gained and outperformed stocks by an average of nearly 40 percentage points; in contrast, bonds over the past half year have lost value and have underperformed stocks by -3.5 percentage points.
The benchmark U.S. T-Bond yield has doubled over the past half year largely because the Federal Reserve has shifted its policy to rate-hiking. But the shift was a reaction to the higher rates of price inflation which the Fed itself substantially caused by instituting previously large increases in the money supply. The CPI rate is now 8.6 percent (the past year’s change through May), up from 4.9 percent over the prior year and a mere 0.2 during the previous year (through May 2020). Prior to the inflation acceleration, the Fed had increased the monetary base by 87 percent from the end of 2019 to the end of 2021 (after having reduced it by 11 percent over the prior two years); the Fed also increased M-2 by 40 percent in the two years ending 2021 (versus a rise of only 10 percent over the prior two years).
Radically excessive money supply expansion has provided fuel for recent accelerating price inflation in the U.S. Initially, when money demand also increased a lot (akin to cash hoarding) money supply expansion didn’t manifest itself immediately in a materially higher general price level. But in recent quarters money demand stopped growing and even declined a bit – a common phenomenon when people begin to see materially higher inflation and expect more of it; they try to spend money balances more quickly, to “beat” faster-rising prices. Lesser demand for money (higher money velocity) only further boosts price inflation (or prevents it from subsiding quickly).
When bonds and stocks decline a lot and simultaneously it suggests inflation is rising rapidly even as the economy is stagnating or contracting (or will soon do so). For most economists today, that combination is near-impossible. Trained in Keynesian demand-side models – and taught to ignore or ridicule supply-side models – they deny that higher inflation is likely to accompany a weakening, let alone stagnating or contracting economy. That’s why they didn’t predict the recent inflation boom. First, they denied it would happen. Next, when it happened, they dismissed it as “transitory.” Now that it has persisted, they finger countless, irrelevant factors – leaving the Fed blameless. As inflation has risen lately, real GDP has contracted; it was down 1.5 percent in 1Q2022 and is flat so far in 2Q2022. Yet the Biden policy mix also does not prioritize economic growth.
We now have “stagflation,” which last appeared in the U.S. in the late 1960s and the 1970s, before the supply-side cures of “Reaganomics.” Keynesian policies remained dominant in the 1960s and 1970s. If any group today should know about stagflation – how to cause and predict it – it would be a group of Keynesians. They were flummoxed by the earlier stagflation and demanded price controls. Monetarists were also confused. Like Keynesians, they had long opposed the gold standard, preferring fluctuating to fixed exchange rates. The monetarists got their wish in 1971 – and conditions only worsened over the subsequent decade. Both “sides” caused that stagflation.
The term “stagflation” was coined in 1965 by U.K. conservative politician Ian Macleod. He sought to describe a rare condition in which inflation was high even though the economy wasn’t growing (or worse, was in recession). Keynesian modelers – who denied that inflation was a debasement of money and rejected the principle that inflation is solely a monetary phenomenon – attributed universally fast-rising prices to real factors: “supply shocks,” and/or an economy that “grew too fast,” and/or a jobless rate that was “too low.” After its coinage in 1965, the use of “stagflation” spread far beyond the U.K. to the U.S. and spread far into the 1970s, due mainly to the abandonment of the gold exchange standard (in August 1971). Stagflation was eradicated for more than two decades only after supply side polices were adopted, beginning in the early 1980s.
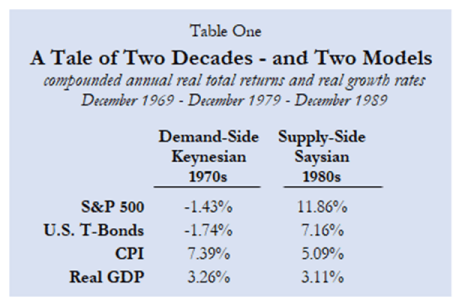
Table One illustrates the vast difference in economic-financial results attributable to demand-side Keynesian policies (1970s) versus supply-side Saysian policies (1980s). In real terms both stocks and bonds lost ground in the 1970s, but both gained ground in the 1980s; in the latter case it helped that inflation decelerated from the prior decade. Economic growth rates weren’t so different between the two decades (due to the recessions of 1981- 1982), but growth rates accelerated throughout the 1980s, after decelerating during the 1970s. Vigor displaced malaise.
Today we’re again seeing a diminution of economic vigor, not unlike the 1970s. Ample evidence over the years proves that as the U.S. government grows, prosperity necessarily slows. But it’s also true that by now many intellectuals, policymakers, politicians, and voters prefer less economic growth, a lesser “human footprint,” to the extent that growth coincides with unequal rewards and climate change. These have always been with us, but many people now prefer that they be curbed.
Beyond disdain for economic growth and its unavoidable, innocuous byproducts (income inequality, climate change), we observe in recent years a fringe bloc of economists pushing “Modern Monetary Theory” and convincing gullible policymakers, and pundits that governments can spend without limit (or reliance on higher taxes), that central banks can create money without limit (or higher inflation rates), and that finance ministers can issue public without limit (or higher interest rates). Only lately have such myths been doubted, albeit only a little bit.
Table Two provides a broader and longer-term perspective on the phenomenon of stocks and bonds performing badly together – and it’s due to stagflation. I partition the history since 1952 into three periods: 1) when both stocks and bonds recorded losses (9 cases), 2) when both stocks and bonds recorded gains (30 cases), and 3) when stocks and bonds recorded mixed results (30 cases). The first combination is rare, as inflation is much higher and economic growth much slower compared to the other two periods. The setting, of course, is the essence of stagflation.
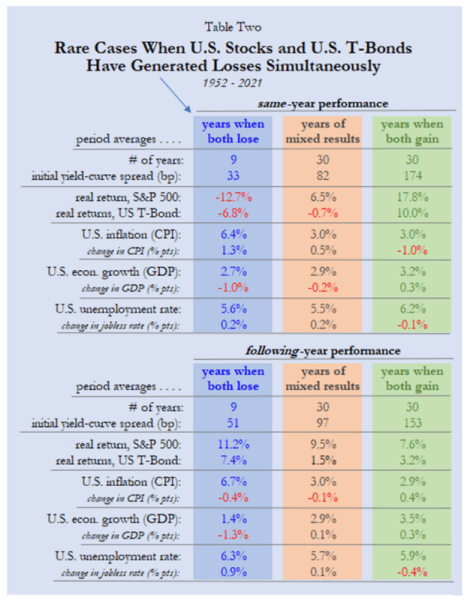
Figure Two further makes clear that the initial yield curve spread is a good forecaster of the joint performance of stocks and bonds. The yield spread is narrower (averaging only 33 basis points) prior to cases when both assets register losses; in contrast, the spread is wider (averaging 174 basis points) prior to cases when both assets register gains.
Historically, the yield curve spread has been narrowest after the Fed has been raising its short-term policy rate (to “fight inflation”); and a negative spread (inversion of the yield curve) has preceded all eight recessions since 1968.
By flooding the system in recent years with excessive government spending, fiat money, and public debt, U.S policymakers made higher subsequent inflation almost inevitable. Now, as the Fed tries to “fix” what it broke, it seeks to put a brake on the economy’s growth rate; so far, it has “succeeded,” as
the U.S. economy has stalled. In time, the Fed’s rate-hiking could again invert the Treasury yield curve and trigger recession. This is the only way a Keynes-driven Fed knows how to “fight inflation.” It’s futile, because relatively less production alone cannot reduce product prices.
I don’t expect Modern Monetary Theorists to apologize for having given such bad advice in recent years. They’re not necessarily done with advising. Their standard prescription for higher inflation is higher tax rates, a Hoover-like policy mix which, if adopted, could easily transform a mild and brief recession into a prolonged and deep depression.
ATTACHMENT #3:
Refer to my paper titled “Inflation or Deflation, May 31, 2021.